Australian eCommerce Benchmarking Report: Retail shifts from April to June 2026
5 August 2026 Blog Posts
The State of Australian eCommerce: Benchmarking Report
During the April to June quarter, Australia’s retail and eCommerce sectors demonstrated ongoing resilience. Data from the Australian Bureau of Statistics (ABS) highlighted a 1.3% increase in household spending for May 2026, pushing annual expenditure up by 5.8% to reach $39.67 billion. They also noted elevated spending across all states and territories.
Heightened demand was primarily driven by seasonal periods and events, such as End of Financial Year (EOFY) sales, where retailers offered strong value propositions to attract cautious shoppers.
These trends are reflected in Australia’s online shopping behaviour. According to the Australia Post eCommerce Report 2026, Australians spent a record $82.6 billion online in 2025, representing 14% year-on-year growth, with online purchases now accounting for 24% of total retail spending.
“The numbers reveal a consistent desire for more: more value, convenience, speed and choice – spanning the entire shopping journey from discovery through to delivery.” – Paul Graham Group Chief Executive Officer & Managing Director at Australia Post
Value has become a defining theme of Australian retail for 2026. With data pointing to 81% of shoppers actively searching for the best deals online, marketplace apps have become almost as influential as retailer websites during the discovery process. Deloitte’s data on spending in 2026 suggests consumers will continue prioritising value over impulse purchases. Another emerging theme of 2026 has been Agentic Commerce. Australia Post found that 62% of Australians now use AI, and 32% already use AI for shopping advice and recommendations.
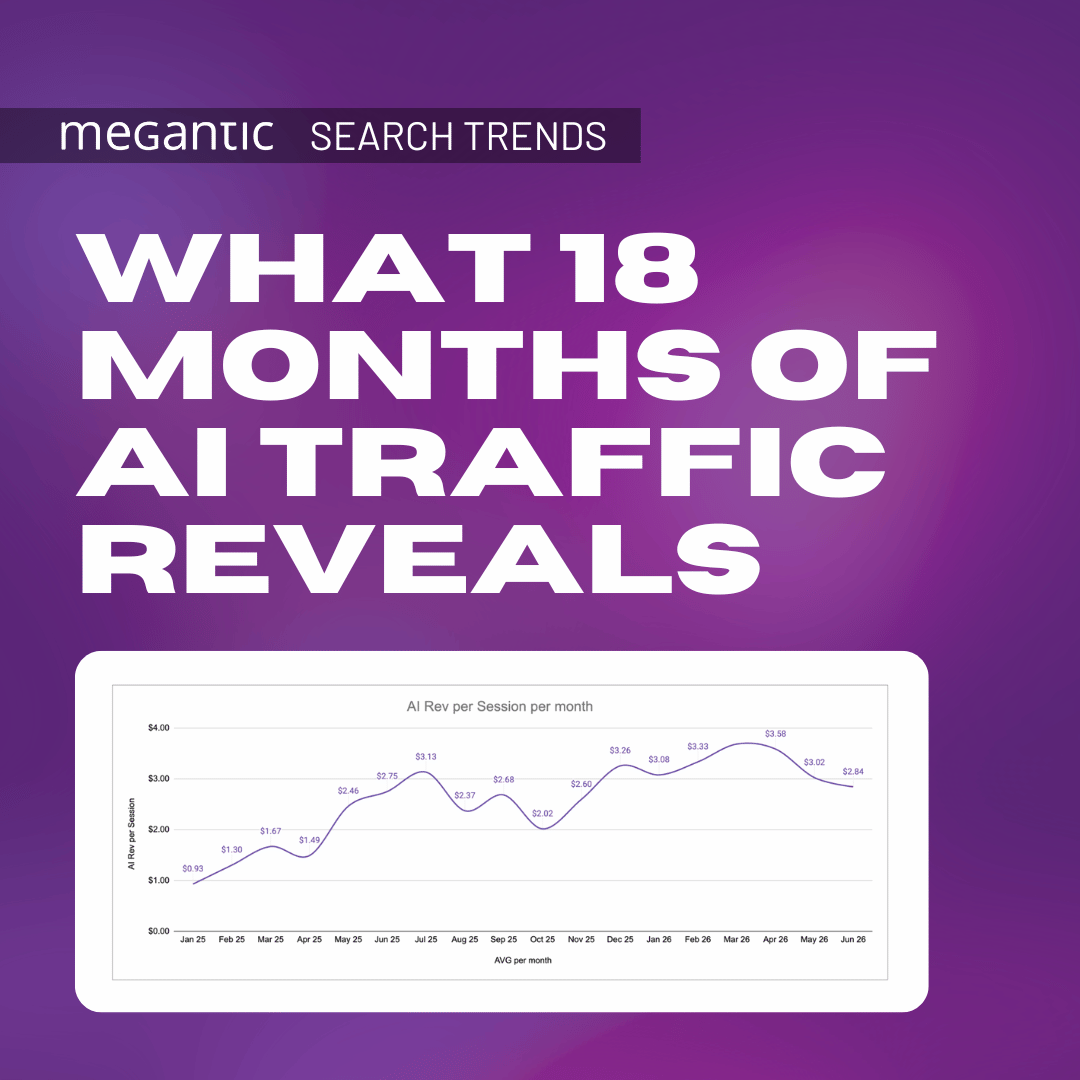
These findings align with our internal data. We conducted a study on AI traffic in 2026 by Megantic’s Continuous Improvement and Data teams, which tracked over 150 clients, and revealed that AI-driven sessions surged by 47% over the past year.
The 2026–27 Australian Federal Budget delivered on Tuesday, 12 May 2026, introduced tax cuts, along with various cost-of-living initiatives. Included in the announcements was a Working Australians Tax Offset (WATO), which would leave more money in consumers’ pockets; but retail analysts predict any uplift in discretionary spending will be gradual. For retailers, the federal budget introduced several measures, including instant asset write-off, loss carry back provisions, reductions in regulatory burden and increased scrutiny of unfair offshore competition. Though these positives may be offset by the ongoing operating costs and political volatility businesses continue to experience.
Fuel prices also remained a key consideration for Australian retailers throughout the quarter. Following heightened tensions surrounding the Strait of Hormuz, global oil markets experienced increased volatility, creating renewed uncertainty around fuel and logistics costs. For eCommerce businesses, these fluctuations in fuel prices had a direct impact on profitability. As retailers continued navigating margin pressures, many faced the challenge of balancing competitive delivery offers with rising fulfilment costs. In the wake of these developments, niche battery electric vehicle sales experienced a major surge. June saw Electric Vehicle (EV) brand BYD achieve an extraordinary 18,881 vehicle sales, a substantial jump from the 8,211 recorded in May. Its main competitor, Tesla, eclipsed its prior records as well. This upward trend points to heightened curiosity among Australians exploring sustainable alternatives and changing consumer behaviour.
Against this backdrop, Megantic’s Benchmarking Report examines how these macroeconomic and consumer trends are impacting individual retail categories. By analysing performance across key eCommerce industries, the report provides practical benchmarks and insights to help retailers understand how their store compares with the wider market and where growth opportunities exist. So let’s get stuck into the numbers!
FY26Q4 Australian eCommerce Benchmarking Report
This benchmarking edition focuses on six core sectors, Apparel & Accessories, Vehicles & Parts, Arts & Entertainment, Business & Industrial, Home & Garden, and Sporting Goods and shines a light on the patterns, trends and stats we can share back to retailers looking to stay competitive.
We are now at a point where we can draw on three years of ongoing analysis to reveal the key trends shaping Australia’s eComm landscape and offer valuable insights at an industry level.
To provide a clear benchmark for performance, we analysed data from over 100 Megantic clients. This report compares current results with the same quarter from previous years.
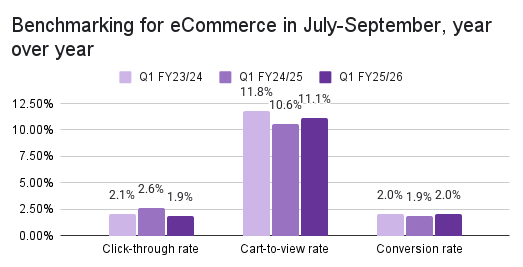
We use three essential metrics to measure these emerging retail trends. These metrics offer immense value and insights, and we believe that these metrics could very well soon expand and change as the AI revolution continues.
Benchmarking Metrics:
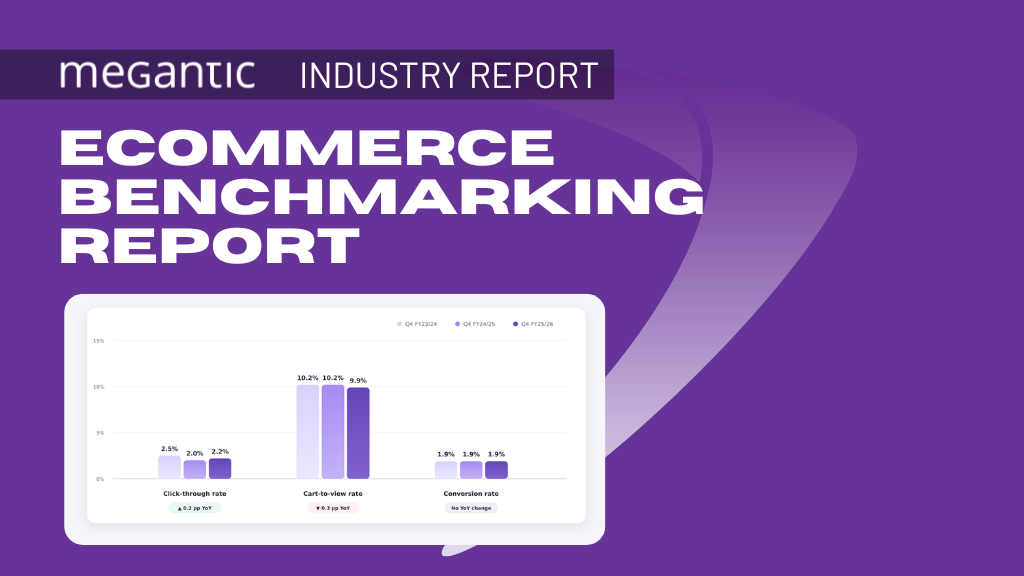
Click-Through Rate: The percentage of searchers who click your link on the search engine results page.
Cart-to-View Rate: The percentage of users who added a product to their cart out of those who viewed the product page.
Conversion Rate: The percentage of website visitors who completed a purchase.
Apparel and Accessories
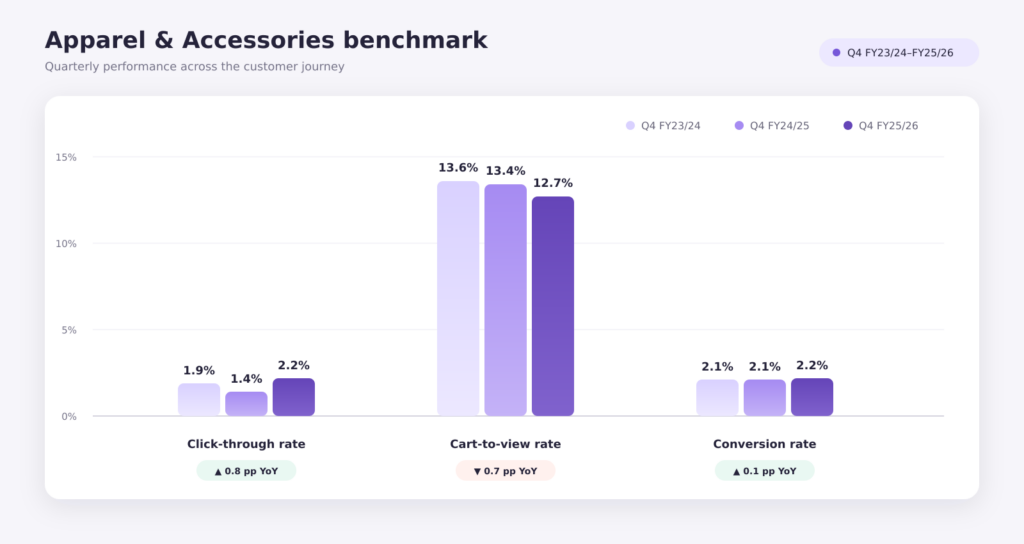
The Apparel & Accessories sector showed encouraging signs for FY25-26Q4, particularly with on-site engagement. Apparel & Accessories produced the strongest conversion performance. Click-through increased significantly from 1.4% to 2.2%, and conversion reached 2.2%, the highest among the industries. However, cart-to-view declined from 13.4% to 12.7%.
This quarter’s standout event is the EOFY sales events. We see high-volume sales of apparel and accessories. With many shoppers holding out for the good deals, retailers in this time period must navigate a landscape defined by more deliberate shopper behaviour and intense market competition.
While the environment seems tenser, particularly from pure-play online marketplaces such as Amazon and Temu, which cater to consumer demand for one-stop shopping convenience. We do see localisation of items and season-specific attire such as winter jackets being ordered online from known Aussie retailers.
Megantic has emerged as a leader within the fashion and accessory space, with 40 – 50 apparel and accessory brands in the Megantic family, including Showpo, Calibre, Oxford, Peppermayo, Zamels, All Things Golden, Aquila, Louenhide and Metro Workwear.
Vehicles and Parts
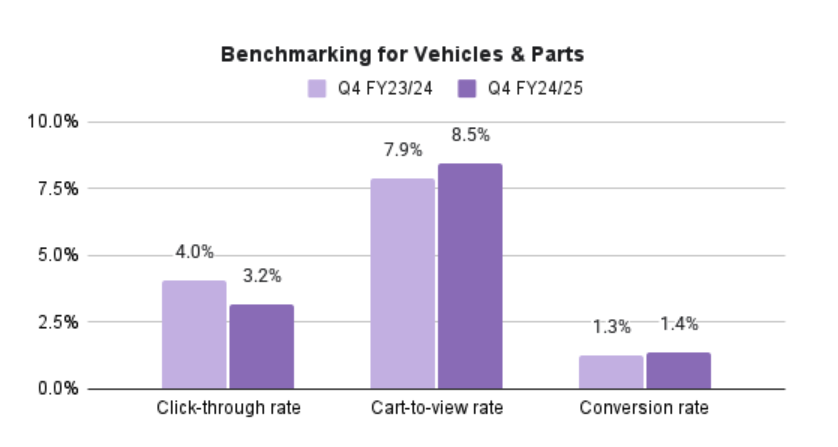
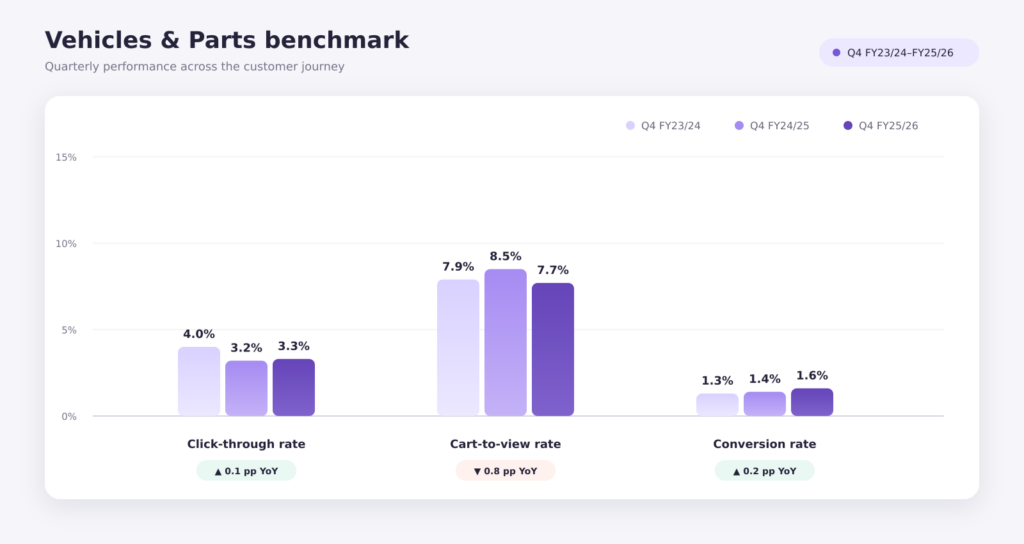
Vehicles & Parts continued to generate the highest click-through rate at 3.3%, well above the overall benchmark of 2.2%. However, its cart-to-view rate fell from 8.5% to 7.7%, and its 1.6% conversion rate remained the lowest of the industry despite improving slightly.
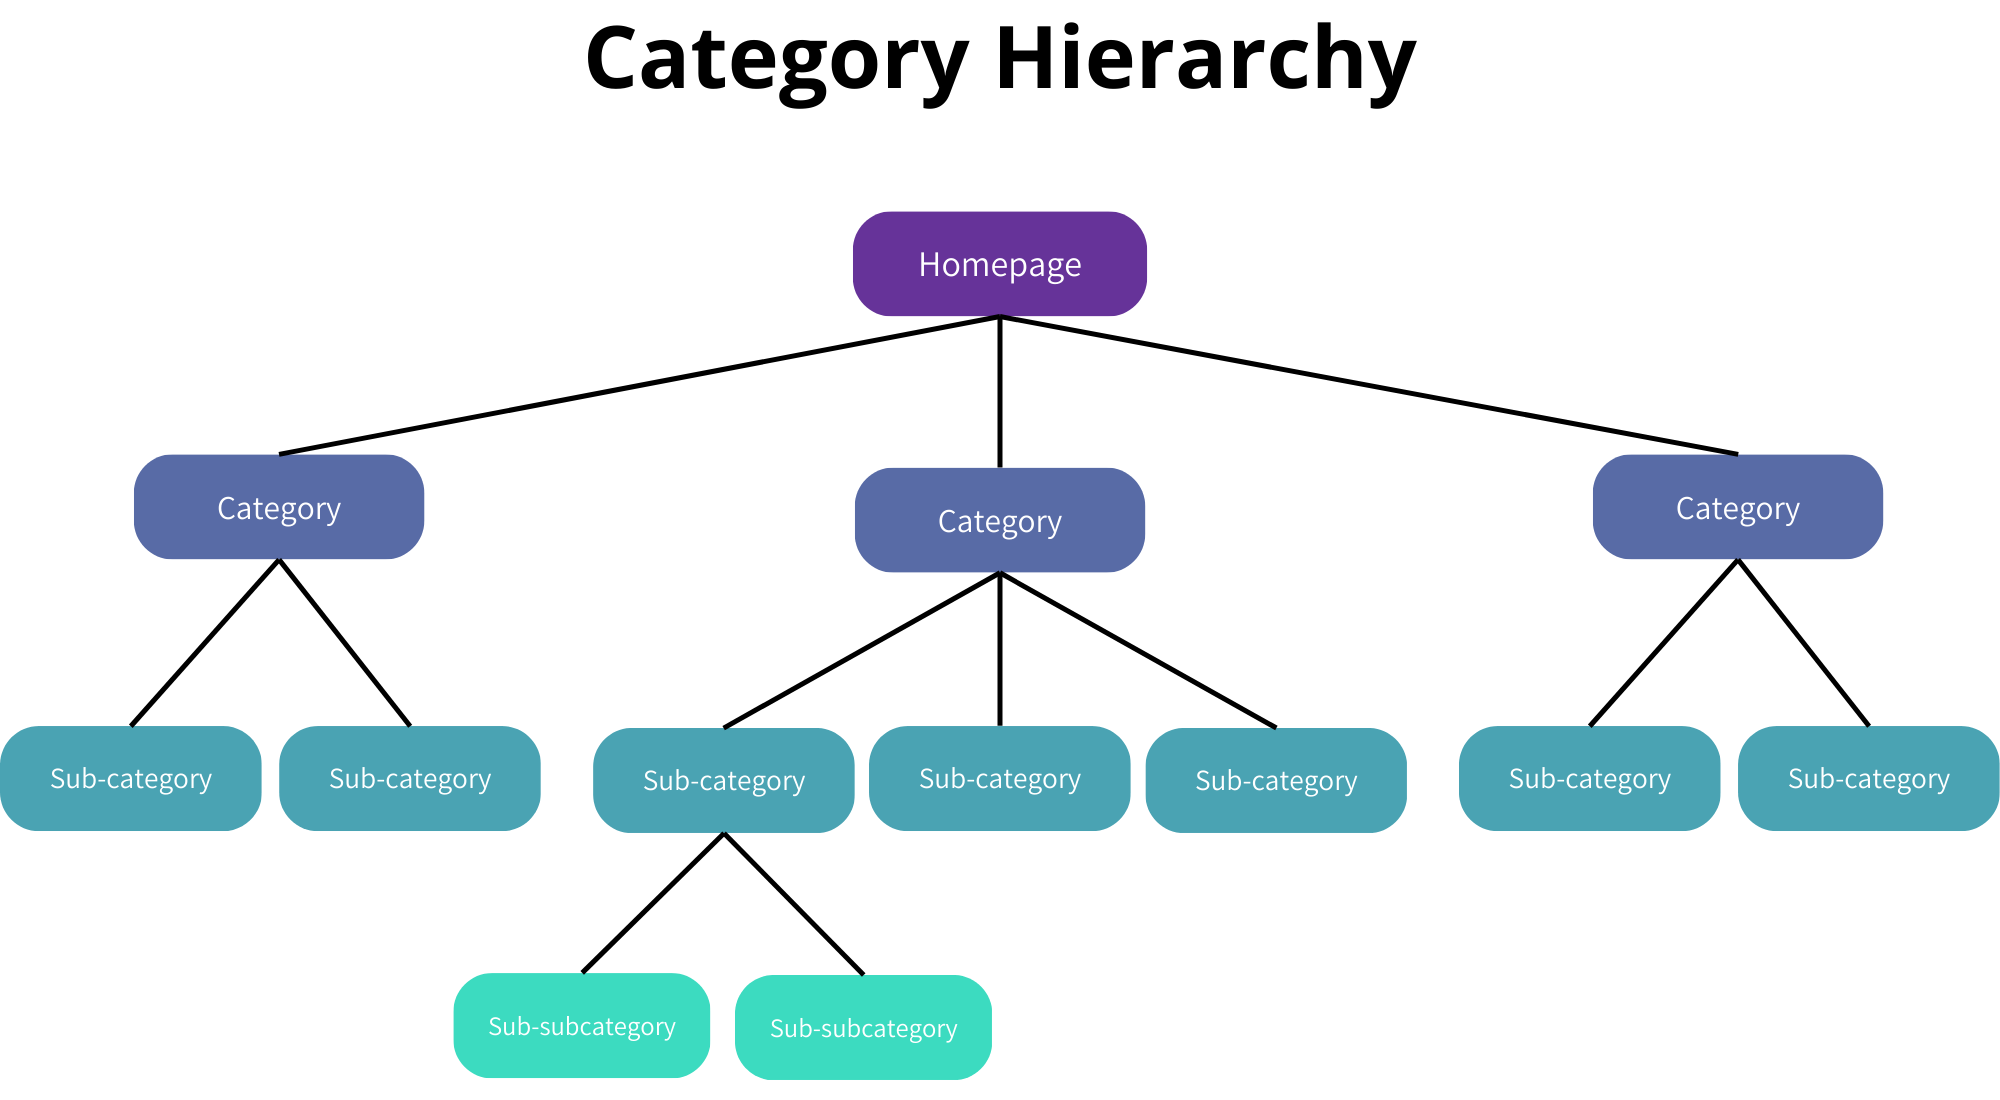
Statistics released by the Australian Automobile Association highlight a significant shift in market composition, with EV and hybrid volumes nearly reaching parity with petrol car sales during the April to June quarter. A clear transition in how Australians are researching their next vehicle purchase. This upward trend in CTR points to a heightened curiosity among Australians exploring sustainable alternatives. For retailers in this niche, these signals underscore the critical necessity of maintaining robust product taxonomy, precise fitment data, and structured schema to capture evolving consumer sentiment.
Megantic has 20 – 30 clients within the Vehicles and Parts space; some of them include Car Builders, OCAM Industries and Everything Caravans.
Arts and Entertainment
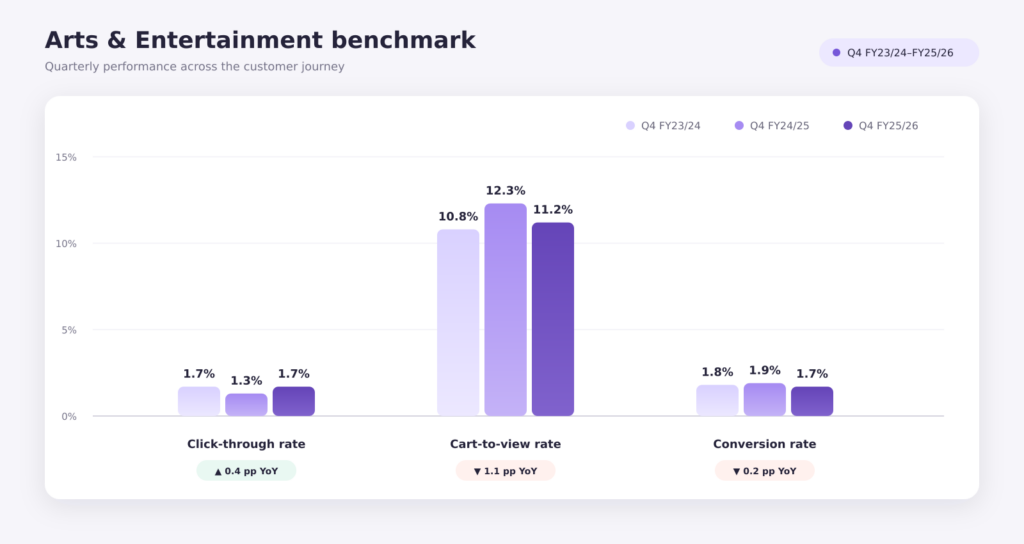
The Arts & Entertainment recovered its click-through rate from 1.3% to 1.7%, but performance weakened further down the funnel. Cart-to-view declined from 12.3% to 11.2%, while conversion fell from 1.9% to 1.7%.
Overall, the sector rebound suggests the Arts & Entertainment Sector continues to feel the effects of tighter household budgets, as consumers take a more cautious approach to discretionary spending, often postponing purchases tied to experiences and hobbies. This trend is a clear indicator of the ongoing pressure on non-essential spending.
Megantic partners with 10 – 20 clients in this category, including Mont Marte, Montana Colours, and Riffs & Licks.
Business and Industrial
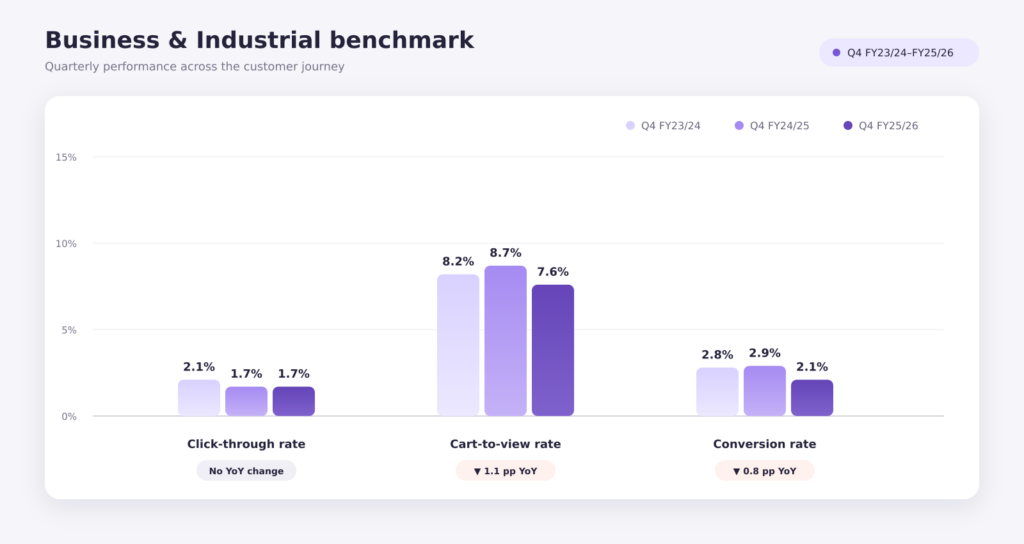
Business & Industrial showed the weakest year-on-year movement. Click-through remained at 1.7%, cart-to-view declined from 8.7% to 7.6%, and conversion dropped considerably from 2.9% to 2.1%.
Local industrial businesses faced a difficult quarter due to rising supply costs and uneven demand. These challenges were worsened by inflation and supply shortages. Furthermore, global instability near the Strait of Hormuz has created concerns about the future stability of supply chains.
Megantic has between 10 and 20 clients in this space; some of our clients in this category include Asset Plant & Machinery and Direct Wholesale.
Home and Garden
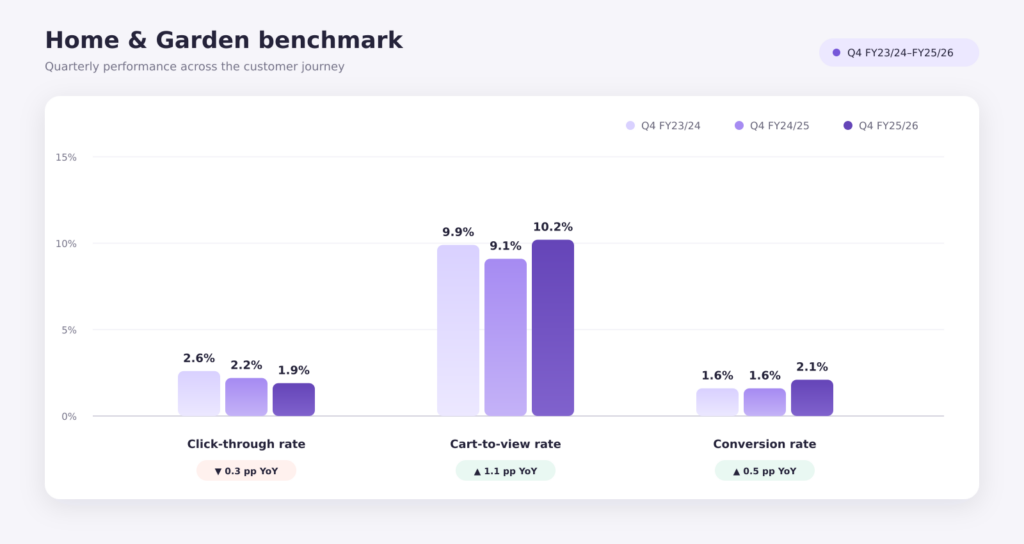
Home & Garden showed the strongest overall momentum. Cart-to-view increased from 9.1% to 10.2%, while conversion rose from 1.6% to 2.1%. Its click-through rate declined from 2.2% to 1.9%, so acquisition remains the main opportunity.
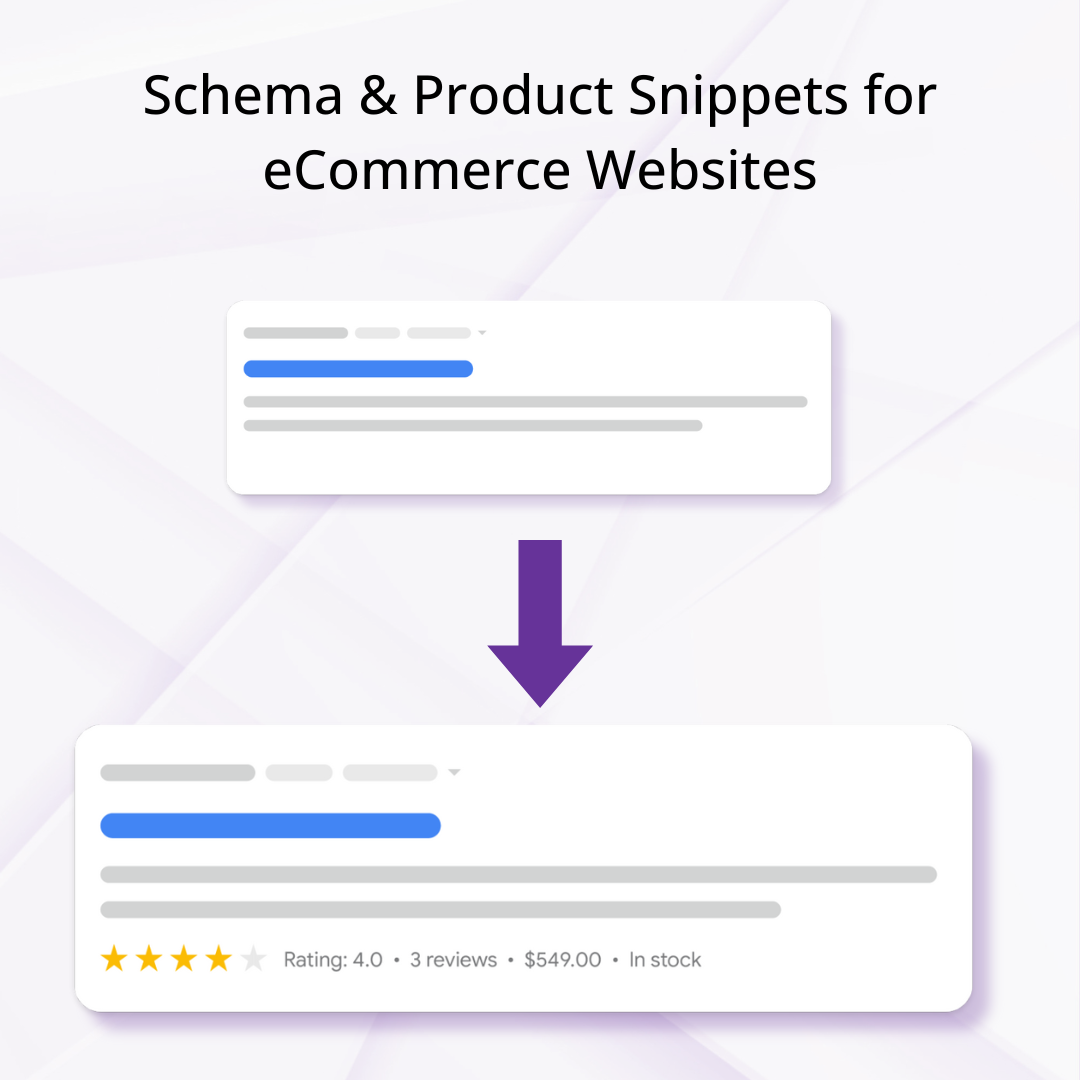
The lower CTR, in this use case, can be viewed in the context of the Zero-Click phenomenon, where users are increasingly finding answers directly within search results or AI-driven interfaces without needing to visit a website. Zero-click searches might not drive direct traffic to your site, but they can still help your business grow by boosting visibility and brand awareness. For Home & Garden retailers, success increasingly depends on attracting highly qualified traffic and ensuring product pages, stock availability and checkout experiences support customers who are ready to buy; ensure product schema is on your product pages. The uplift in conversion alongside flat engagement suggests improved alignment between product offering, pricing, and user expectations.
Seasonal weather and environmental factors play a pivotal role in this sector. Tactical merchandising, spanning indoor living, winter maintenance, heating solutions, and EOFY promotions, likely drove the stronger downstream performance, offsetting the decline in click-through rates.
Megantic has between 20 and 30 clients in this niche, including Kitchen Warehouse, Pony Rider and Matchbox.
Sporting Goods
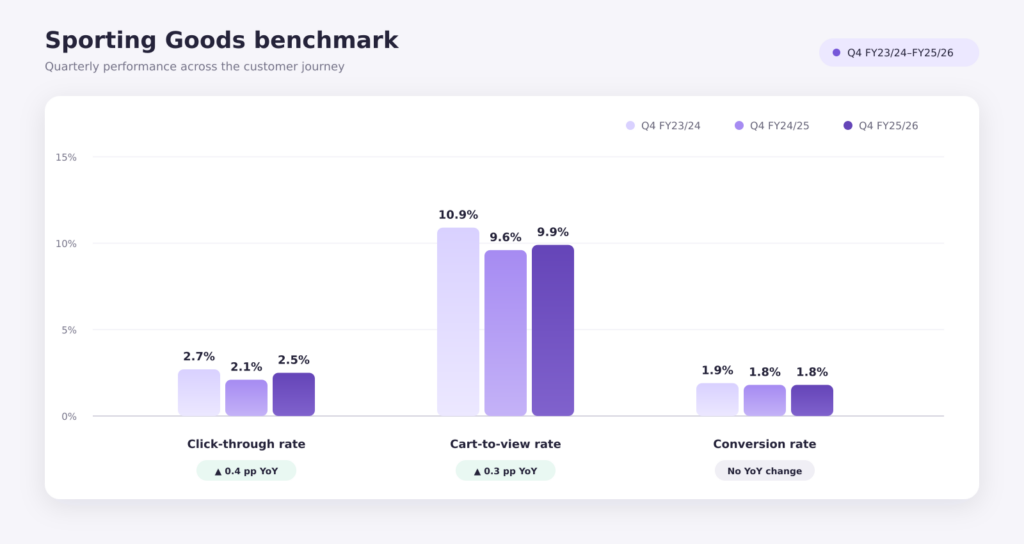
Sporting Goods improved at the top and middle of the funnel. Click-through increased from 2.1% to 2.5%, and cart-to-view rose from 9.6% to 9.9%. Conversion remained stable at 1.8%. This growth could be linked to major local and global sporting events including the AFL season, the FIFA World Cup 2026 opening stages, the French Open, and the Monaco Grand Prix. These events helped drive engagement across sportswear, equipment, merchandise, and fitness-related categories, as consumers looked to participate, support teams, and connect with community.
Megantic has between 10 and 20 clients in this space; some of them include House of Golf, Whack Sports and Wahu.
Key Takeaways
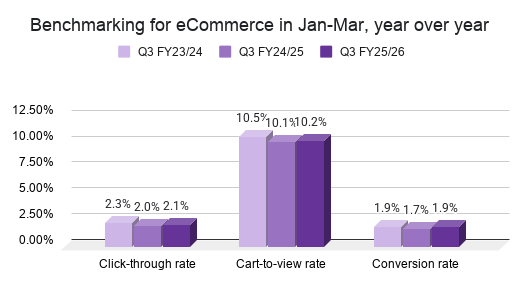
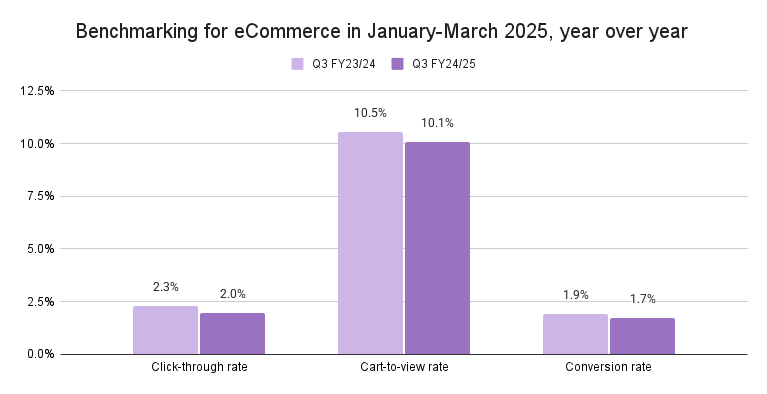
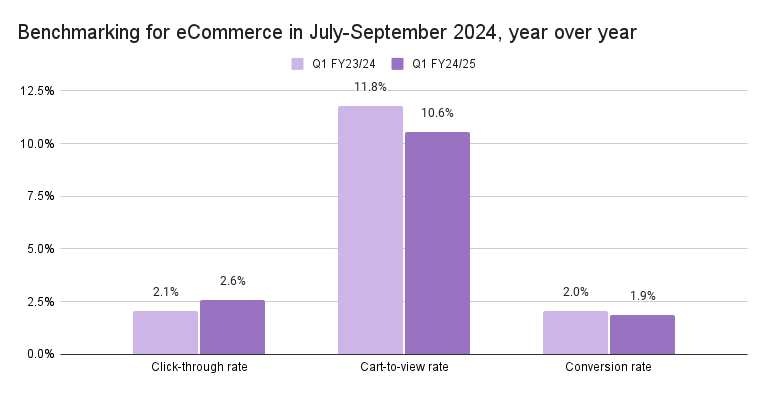
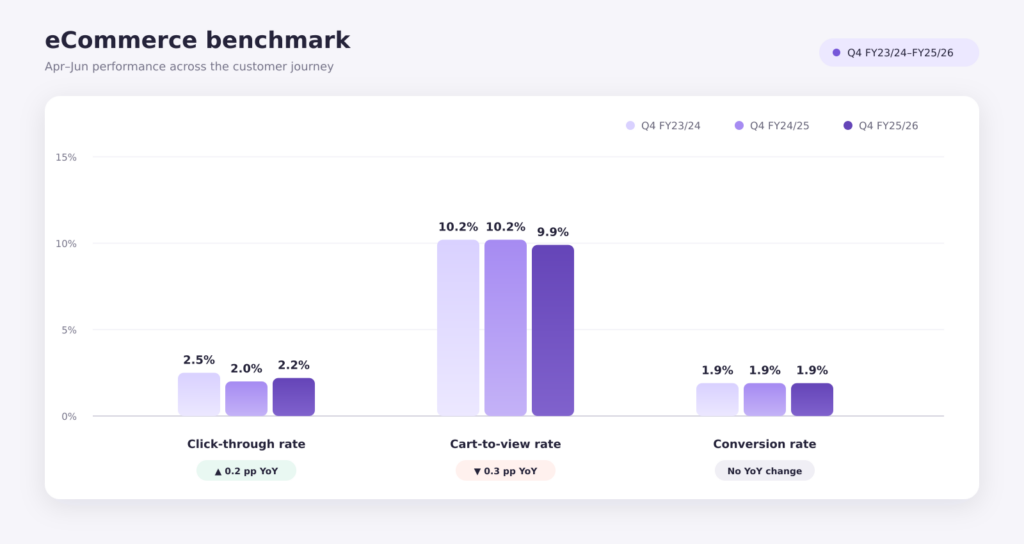
Overall, Home & Garden has the strongest positive momentum, Apparel & Accessories delivers the best current conversion results, and Business & Industrial requires the most attention. The common optimisation opportunity across the portfolio is improving the transition from product view to cart. Across eCommerce overall, performance is broadly stable. Click-through rate improved from 2.0% to 2.2%, cart-to-view softened slightly from 10.2% to 9.9%, and conversion remained unchanged at 1.9%.
This benchmarking data aims to help Aussie retailers better understand the forces transforming the ways of shopping and search behaviour, so as to prepare for the next wave of growth. And we’ll monitor the final quarter of the financial year and beyond as we enter a high-pressure EOFY period.
If you’re refining your online search strategy or simply curious about how others in your space are tracking, these insights can help guide more informed, realistic growth goals. Used strategically in your business, benchmarking data could help you find opportunities for improvement, set informed targets and drive your business growth.
AI continues to reshape Australia’s retail landscape
The April to June period witnessed rapid transformation as the AI revolution continues to reshape the technological landscape.
Our best recommendation to all retailers in the market is to strongly align your SEO and AEO strategy with evolving consumer behaviour and industry trends, so that you can make smarter, data-backed decisions that lead to stronger results.
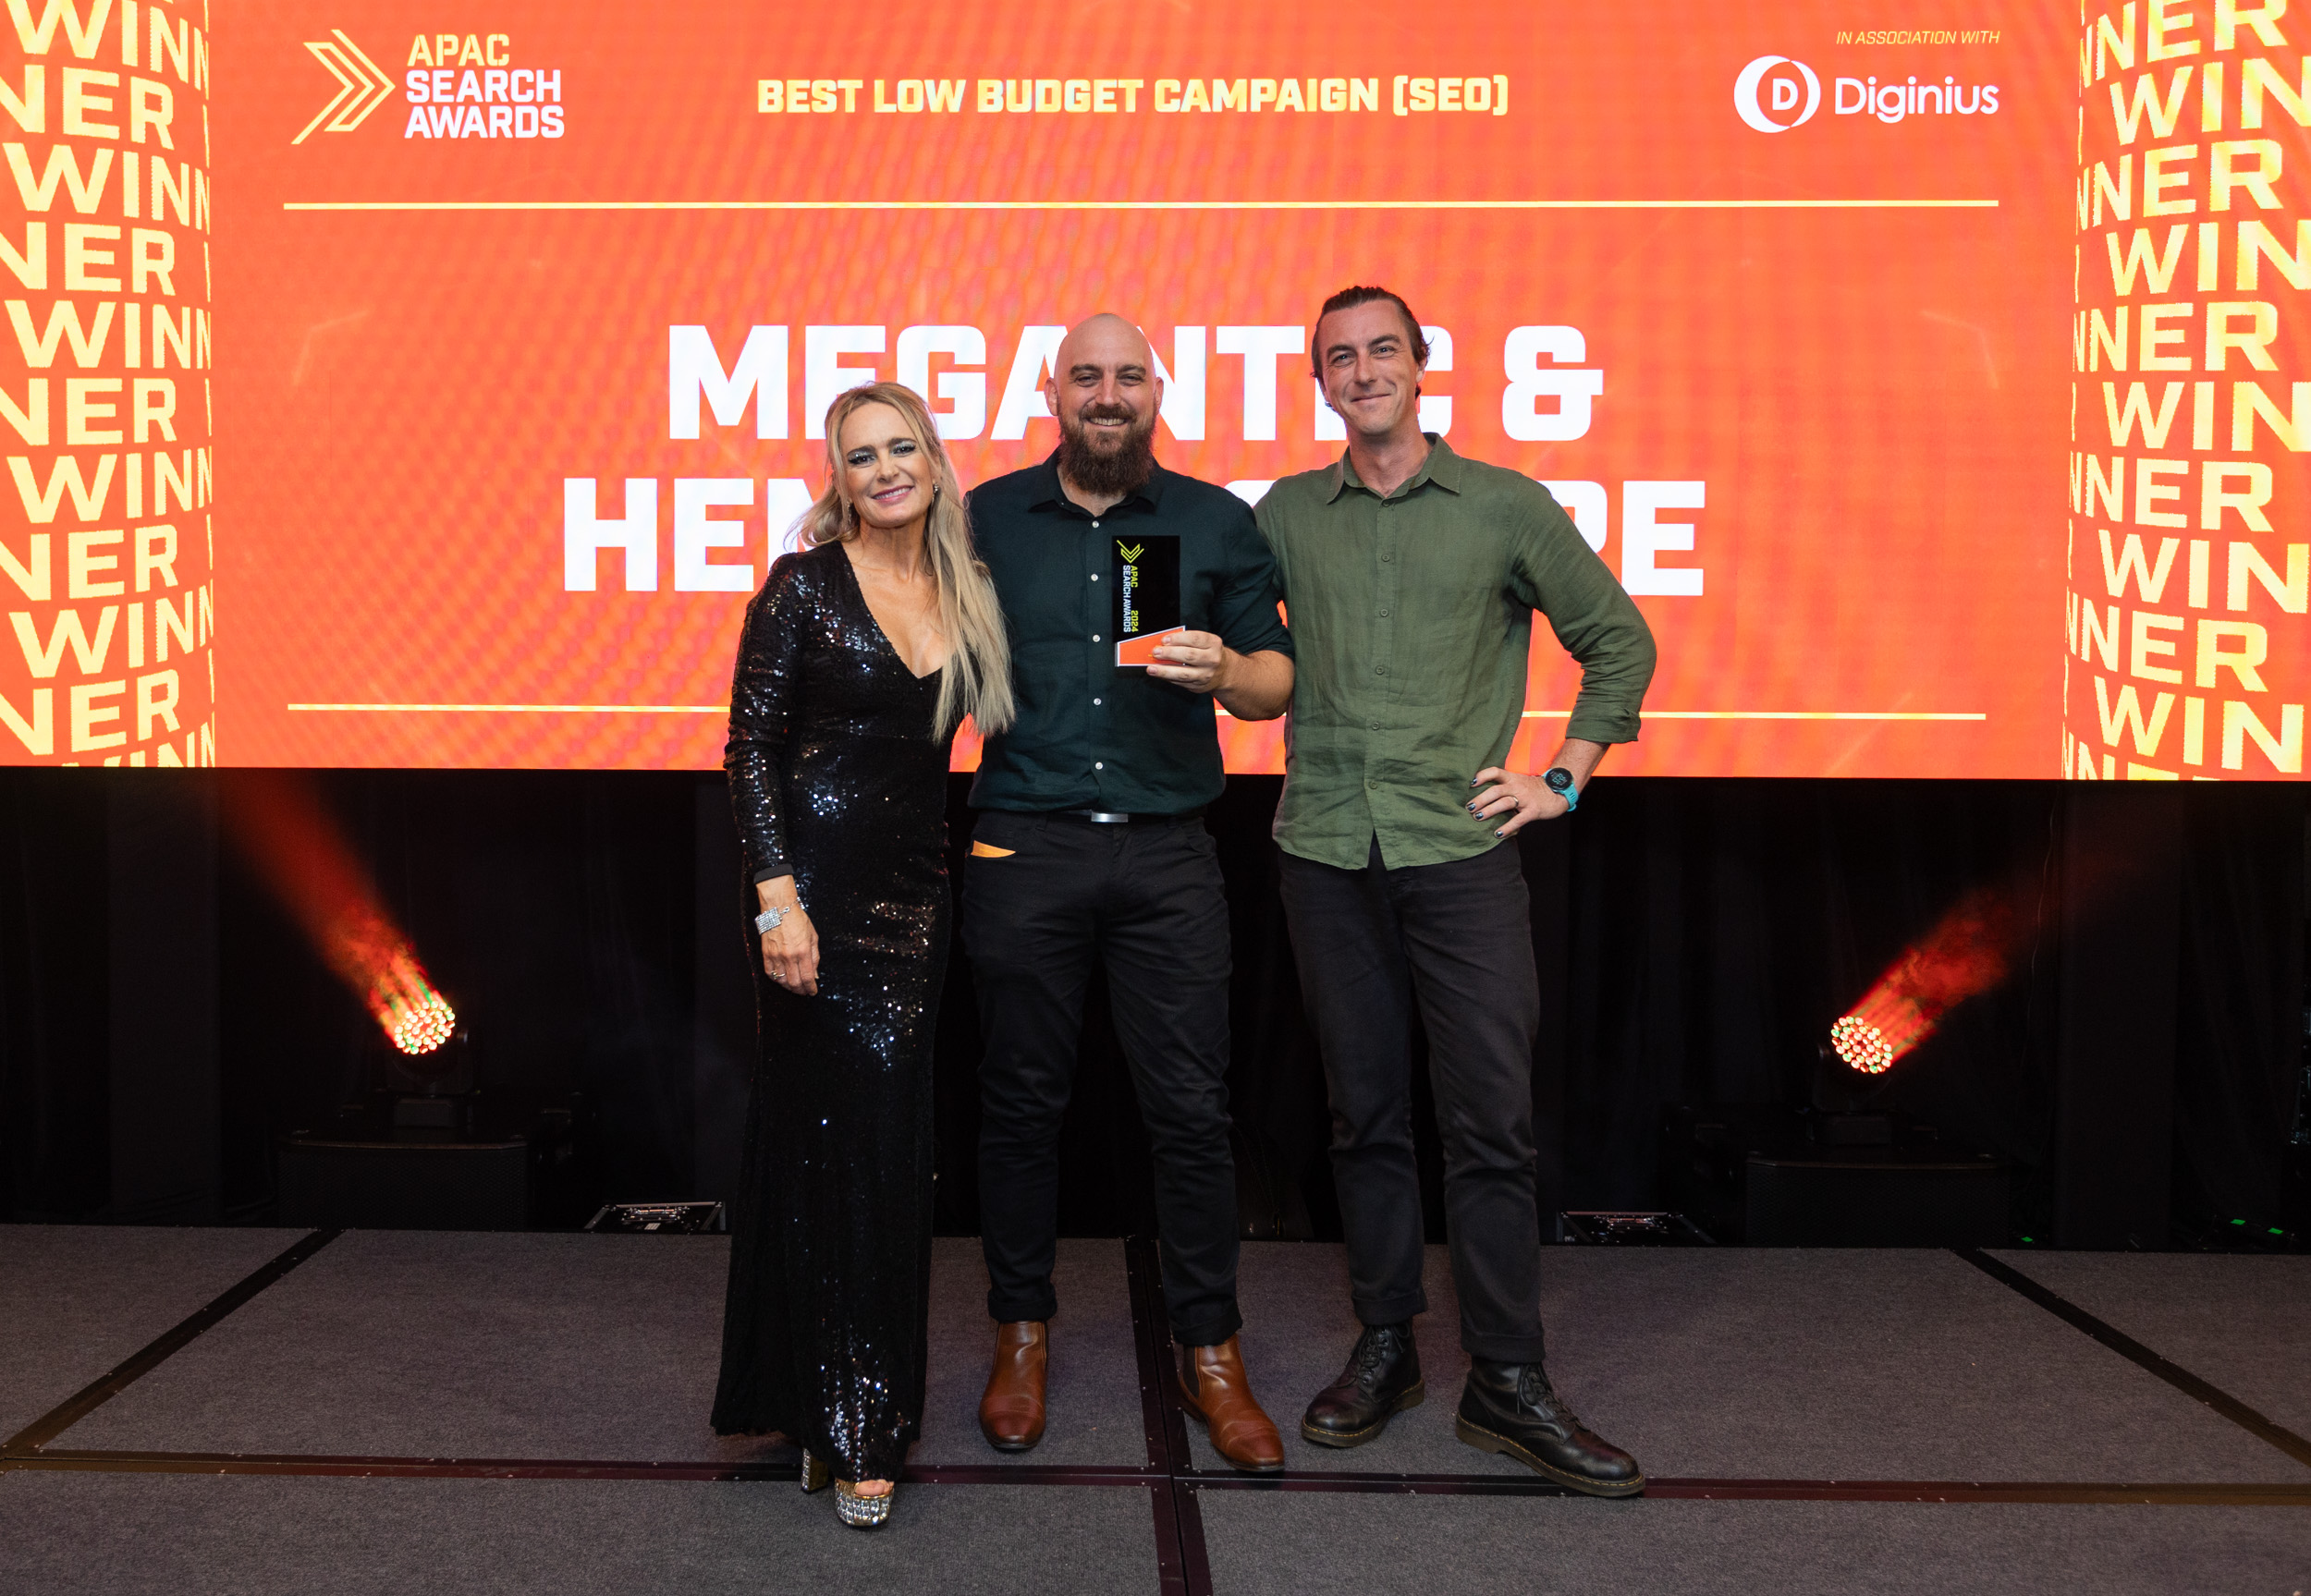
We recently won ‘Best eCommerce Agency of the Year’ at the 2026 Global Agency Awards for the third consecutive year, and our recently launched AI SEO toolkit is shortlisted for ‘Best Software Innovation’ at The Global Search Awards 2026. And to celebrate this recognition, we’re offering brands with $1M+ revenue a free 1-month trial, including an AI Visibility Audit and readiness plans.
If you want help benchmarking your brand’s visibility against competitors and improving your online AI and GEO visibility, give us a shout.