Optimising Site Speed for eCommerce Websites
25 October 2023 Blog Posts
Page speed, likened to the super-speed abilities of Superman and The Flash, is a pivotal metric in the SEO universe. Faster-loading websites, akin to Superman’s efficiency, enjoy higher rankings and better user engagement, reducing bounce rates. The Flash’s rapid information delivery mirrors the importance of quick access for converting visitors. Slow loading times and decrease in engaged visitors act as SEO villains, hindering website success. The optimal strategy lies in combining Superman’s strength (valuable content) with Flash’s speed, ensuring a seamless user experience and enhanced organic rankings for ultimate digital triumph.
In this blog, we’ll delve into the significance of page speed and the key metrics Google’s Core Web Vitals (CWV) use to evaluate user experience.
Understanding Page Speed
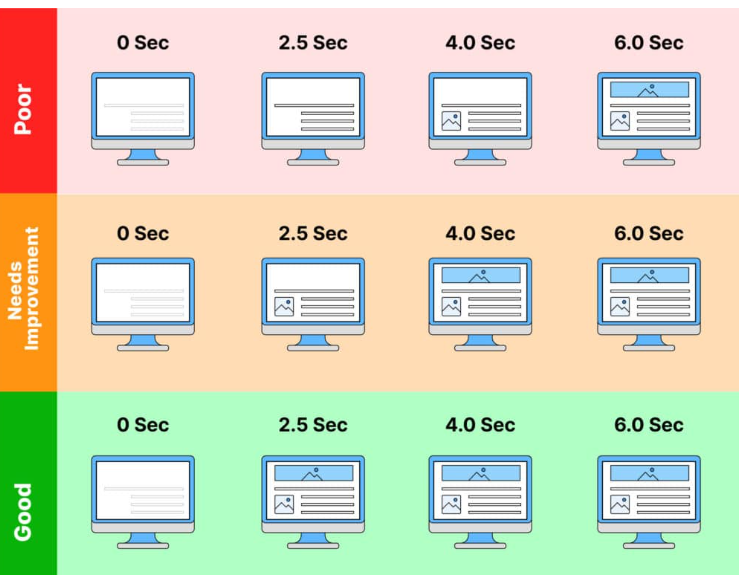
Page speed, as defined, measures the swiftness with which a webpage’s content loads. A website’s speed is a critical ranking factor, impacting both desktop and mobile performance. Google’s Core Web Vitals are a set of metrics designed to score the user experience of a page. These metrics revolve around three key aspects: load time, interactivity, and visual stability.
Key Core Web Vital Metrics
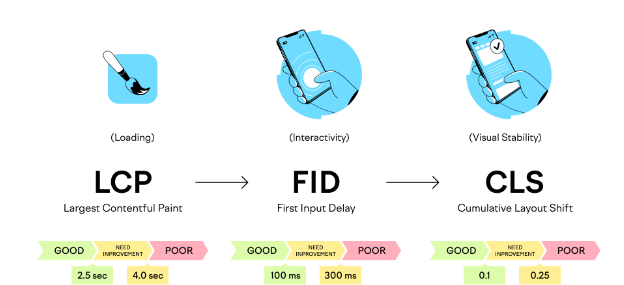
Largest Contentful Paint (LCP): measures how long it takes for your main content to load. This should ideally be 2.5 seconds or less.
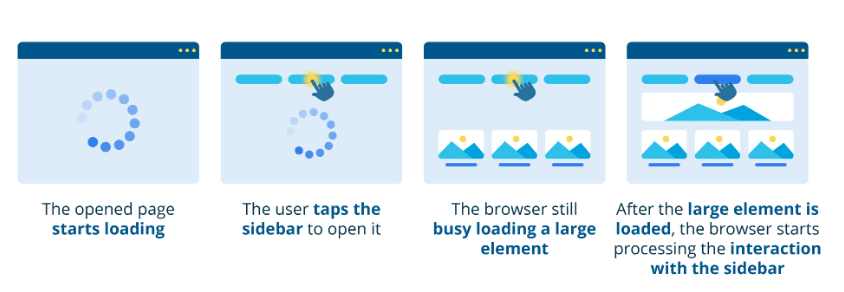
First Input Delay (FID): measures how long it takes until a user can interact with a page. This should aim to be no more than 100 milliseconds.
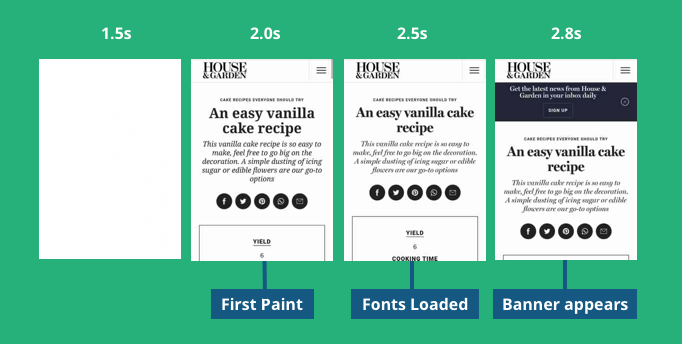
Cumulative Layout Shift (CLS): measures how often users experience layout shifts. An ideal CLS score is 0.1 or less.
Tools to Check Your Page Load Time
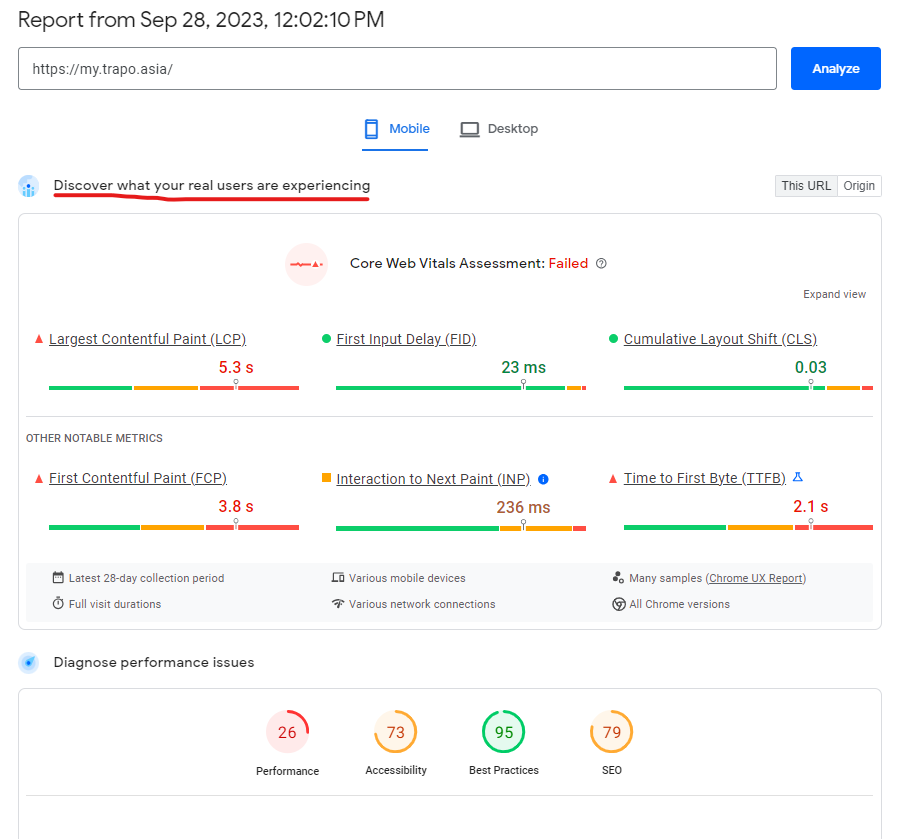
You can assess your page’s load time using various tools, such as Google PageSpeed Insights (PSI), Lighthouse, GTmetrix, or Pingdom. PageSpeed Insights, for example, provides a score between 0 and 100, where a higher score indicates optimized speed and efficiency. It also offers suggestions for improvement.
The Impact of Page Speed
As a real life example, the BBC discovered that they lost 10% of their total users for every additional second it took for their pages to load.
Types of Data in CWV Reports
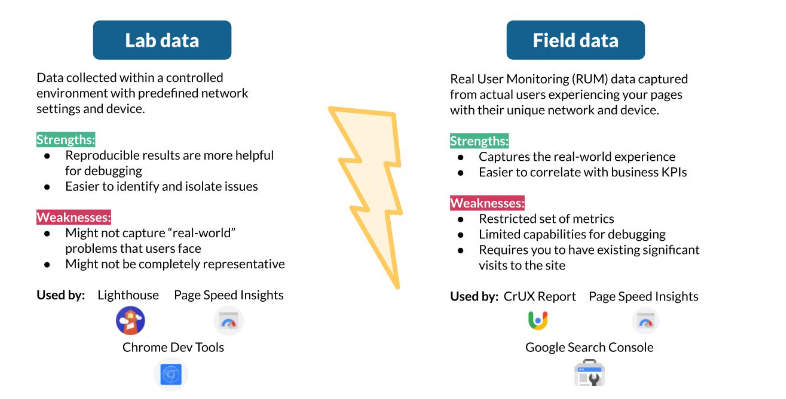
Field Data: This data is based on real user experiences. Google Search Console (GSC) utilises field data.
Lab Data: Lab data is based on theoretical technical crawl scores. Lighthouse uses lab data.
Origin Data: aggregate of field data across all pages on a domain. This is useful when a page lacks sufficient field data. This type of data can be found in PageSpeed Insights.
CWV scores (particularly field data such that found in GSC) will depend on the users’ internet speed and device speed. However, this will not have a significant impact on rankings.
It will take 28 days for Google to re-evaluate field data scores after implementing a change or adjustment.
Looking at https://pagespeed.web.dev/:
PageSpeed Insights reports show field data at the top, and lab data below it:
Lighthouse reports however, only show lab data, not the field data.
It is best practice to run a test on each page template for a site (eg. homepage, category page, product page for ecommerce sites)
Common Opportunities to Improve Page Speed
These are some common opportunities that can be seen from CWV tests such as from PageSpeed Insights.
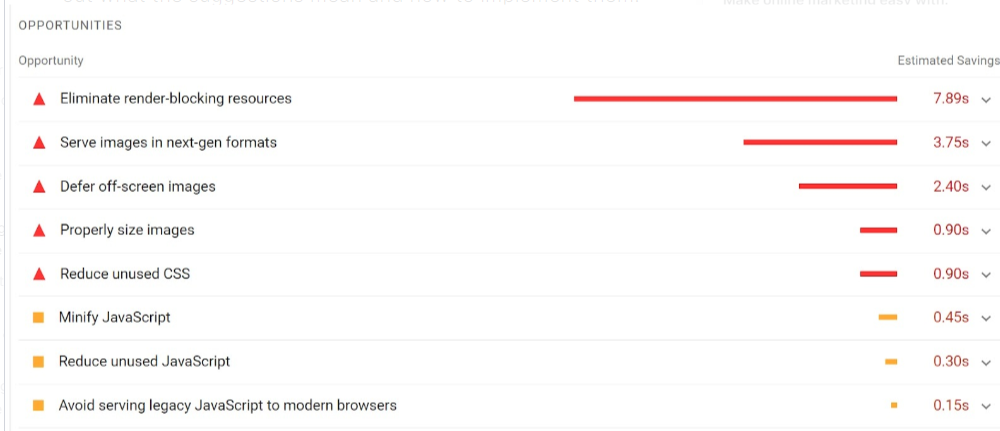
Eliminate render blocking resources: either JavaScript (JS) or CSS styling that is delaying or ‘blocking’ the rendering of the page content. Render-blocking resources become an issue when they are crucial for the initial rendering of the page, and they must be loaded and executed before the browser can display any content to the user. Third party apps/ plugins are run by JavaScript that is often render-blocking. An ideal solution would be to remove these, but if that is not an option, some ways to manage these include deferring or loading these scripts asynchronously (asyncing).
Serve images in next gen format: often, you may find images in JPEG or PNG formats on sites. This is an older image format. WebP file formats are more optimised for modern browsers, so converting any JPEG or PNG images to a WebP file format is a solution.
Defer off-screen images: offscreen images are images that are not initially visible to the user when they first load the page. Often, these images only appear after the user interacts with certain elements. These offscreen images can be ‘deferred’, or loaded later after the onscreen images have been loaded. This can be done via lazy loading.
Properly size images: if the image is too large, this can lead to slower loading times. Reducing the size of the image can help speed up the loading process. Otherwise, compressing the image to be of a lower resolution can also help.
Reduce unused CSS: similar to render-blocking resources, deferring or asyncing these scripts is ideal when removing these files are not an option.
Minify JavaScript: break up or parse JS into more manageable chunks, to improve loading efficiency.
Reduce Unused JavaScript: can be handled the same way as reducing unused CSS.
Avoid Serving Legacy JavaScript to Modern Browsers: Some old sites may use JavaScript that is out of date. JavaScript is a relatively old language and older versions are often not optimised to run on modern web browsers. It is best to update the JavaScript on site to the latest version if possible.
LCP Example Issues
| Potential Issues | Solutions |
| Large Images | Resize images
Compress images Lazy load images Remove images Use WebP images Defer offscreen images Preload the LCP image |
| Slow Server Response Time | Switch to a faster server
Use a content delivery network (CDN) Cache Assets Avoid redirect chains |
| Big Files | Minify CSS
Minify JS Defer non-critical JS and CSS |
FID Example Issues
| Potential Issues | Solutions |
| Large JavaScript Files and Render Blocking | Minimise and defer JS; reduce size and number of files, and use async or defer attributes to prevent them from blocking rendering.
Split large JS scripts into smaller ones Implement lazy loading |
| Third Party Scripts | Load scripts asynchronously
Defer the scripts |
CLS Example Issues
| Potential Issues | Solutions |
| Font flickering | Preload Fonts |
| Ads or dynamically inserted elements | Reserve space for all elements
Set dimensions for elements |
| Images without dimensions | Set height and width dimensions for images |
Platform Specific Optimisations
Shopify Page Speed Improvements
- Check each template URL in PageSpeed Insights (Home, Collection, Product, Blog)
- Remove Unused Apps. Each app you have uninstalled might leave additional lines of unused code.
- Remove legacy code: Check your theme and apps for any outdated or unused code snippets. These legacy scripts might conflict with newer code or slow down your site’s performance.
- Enable lazy loading.
- Check image sizes.
- Avoid redirect chains.
- Benchmark your site against competitors
Maropost/ Neto Page Speed Improvements
- Optimise large images (eg. compress these)
- Actionable Item: in Screaming Frog, you can use the PageSpeed API and provide a list of images over 150KB to a client, as priority images to optimise.
- Remove unwanted plugins.
- Enable lazy loading.
- Avoid redirect chains.
WordPress Page Speed Improvements
- Unoptimised images – install Smush plugin to compress images and enable lazy loading
- Remove unwanted plugins.
- Outdated WordPress/Core, Themes, or Plugins.
- Check hosting service provider – WP Engine is a great service provider.
- Nitro Pack WordPress plugin – Automates most to the above for you.
Other Common Issues
Beware of search APIs like Search Spring and Findify, which are heavily reliant on JavaScript. Algolia is often a better alternative.
CrUX Data Studio Dashboard
If you have domain-level access in GSC, you can enable the CrUX Data Studio Dashboard. It provides a historical view of CWV scores over each month, helping track site progress. Remember that CrUX data is based on the last 28 days of user interactions, so site changes will take 28 days to be reflected.
Where to find and create a CrUX Report: https://developer.chrome.com/docs/crux/dashboard/
One of the tasks we complete in Stage 3 of our award-winning three stage strategy for SEO growth is improving page speed. Get in contact with us today to see if we can help you grow online.
![]()


")


