In-Depth FY24/25 Q3 eCommerce Data Analysis
1 May 2025 Blog Posts
Megantic’s Benchmark Report offers a closer look at which industry niches are seeing growth and what that could mean for your business. This report uses data across six key industry niches: Vehicles & Parts, Apparel & Accessories, Arts & Entertainment, Business & Industrial, Home & Garden, and Sporting Goods.
In the Q3 FY25 edition, we looked at 100+ Megantic clients to see how they’re performing in comparison to last year’s fin year.
We measure these emerging retail trends using three essential metrics:
Click-Through Rate (CTR): The percentage of users who clicked on an organic Google Search result after seeing it in the search results, also known as “SERPs”.
Cart-to-View Rate (CTV): The percentage of users who added a product to their cart out of those who viewed the product page.
Conversion Rate (CR): The percentage of website visitors who completed a purchase.
So, whether you’re refining your strategy or simply curious about how others in your space are tracking, these insights can help guide more informed, realistic growth goals.
The state of eCommerce: retail shifts January-March 2025
Retail activity in Australia showed tentative signs of recovery early in 2025. Australia wrapped up FY25Q2 on a stronger-than-expected note, with GDP climbing 0.6% in December 2024, note that’s the best growth Australia has seen since December 2022, according to KPMG in their Australia Economic Outlook Report (April 2025).
While the numbers hint at momentum building, there is an air of uncertainty in the general eCommerce landscape. Between January and March, a wave of disruptions hit retail. We saw the announcement of US tariffs and a string of voluntary administrations for iconic Aussie brands: Jeanswest, Godfreys, Mosaic Brands (Ally Fashion, Rivers, and Michel’s Patisserie), to name a few. While these brands are closing their “doors”, some are moving online. These changes are in response to rising costs, reduced consumer spending, and shifting shopping behaviours. While the pivot to digital channels may increase the need for stronger SEO, it more clearly reflects a retail landscape under pressure. Jeanswest cited “increasingly tough trading conditions in the Australian retail sector, with shoppers spending less due to the higher cost of living” as a key reason for closing all 90 of their stores.
The Australian Bureau of Statistics (ABS) highlighted seasonal trends, noting a lift in spending on services like dining and recreation. However, this was offset by cautious consumer behaviour, with a drop in household goods purchases following the holiday period.
Vehicles and Parts
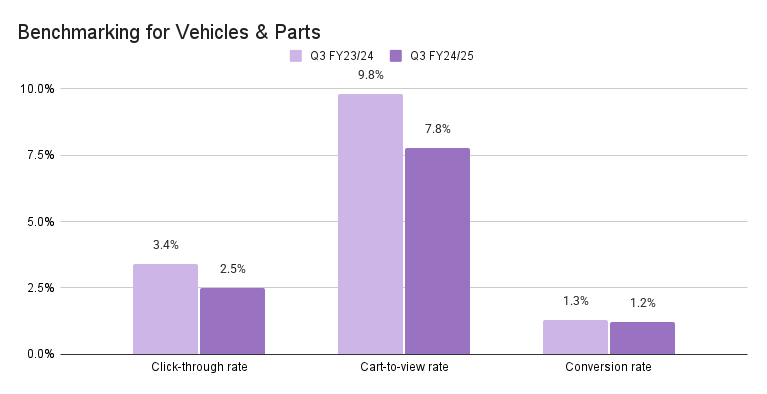
The Q3 benchmarking data for Vehicles & Parts reveals a downward trend across all key metrics, with click-through rate dropping from 3.4% to 2.5%, cart-to-view rate from 9.8% to 7.8%, and conversion rate slightly declining from 1.3% to 1.2%. This reflects broader challenges in Australia’s automotive sector, reflecting weaker shopper engagement and rising price sensitivity.
With this niche, we typically find that the users searching for automotive products have a lot of knowledge about their purchasing decision, and typically are precise in their search, specifying details such as car make, model, and year to find the exact product they need. Automotive purchases, even for parts, tend to involve longer research cycles and considered decision-making.
Megantic has 20 – 30 clients within the Vehicles and Parts space, some of them include Car Builders and OCAM Industries.
Apparel and Accessories
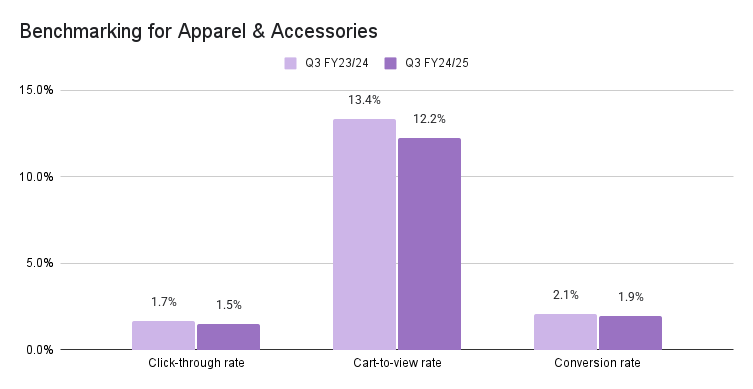
This quarter, the apparel and accessories sector saw a modest dip across all key eCommerce metrics. Click-through rates dropped from 1.7% to 1.5%, cart-to-view rates fell from 13.4% to 12.2%, and conversion rates declined from 2.1% to 1.9%.
We’ve seen this category to be one of the most competitive in eCommerce, likely due to strong consumer demand, the presence of both global and local brands. It’s been a difficult year for the apparel and accessories space, with several iconic Australian brands forced to shut their doors. Notable closures for 2025 include Rivers, Millers, Noni B, Katies, Rockmans, Autograph, Crossroads, W Lane, and BeMe.
Megantic has 20 – 30 clients within this category. Some of our clients include Aquila, Ripe Maternity, and Louenhide.
Arts and Entertainment
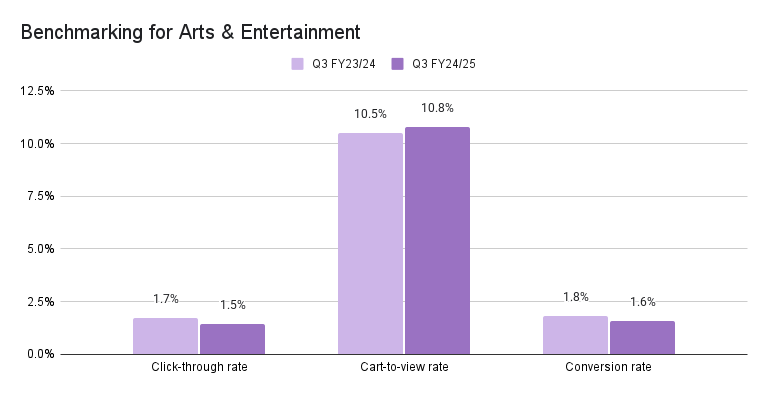
The Arts & Entertainment sector delivered a mixed bag in Q3 FY24/25. While the click-through rate declined slightly from 1.7% to 1.5%, the cart-to-view rate edged up from 10.5% to 10.8% — a sign that engaged users are more intentional in their shopping. However, the conversion rate dropped from 1.8% to 1.6%, suggesting friction at checkout.
The Arts & Entertainment sector appears to be feeling the pinch of cost-of-living pressures, with discretionary spending on experiences and hobbies more likely to be delayed in a climate of cautious consumer sentiment.
Megantic has between 10 – 20 clients in this space, some of them include Monte Mart, Montana Colours and Riffs and Licks.
Business and Industrial
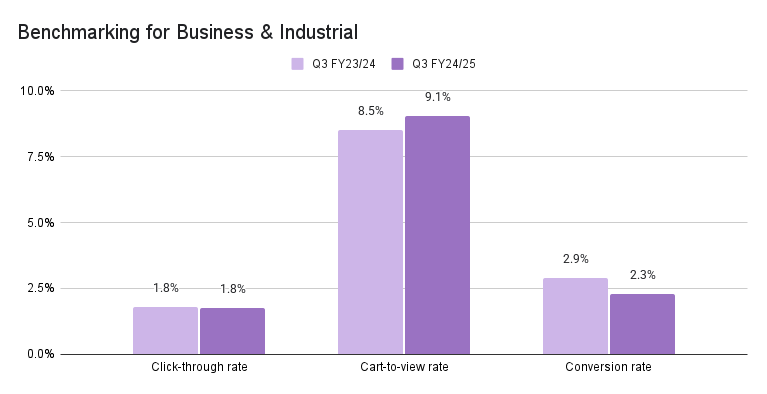
The Business and Industrial sector showed stable interest and intent to purchase stats, the click-through rate holding steady at 1.8%. Notably, the cart-to-view rate climbed from 8.5% to 9.1%, indicating improved product engagement once users reach the site. However, the conversion rate dropped from 2.9% to 2.3%, pointing to potential roadblocks in the final purchase step. For B2B retailers, this highlights the importance of refining checkout processes and reinforcing buyer confidence during decision-making.
Megantic has between 10 – 20 clients in this space, some of our clients in this category include Asset Plant & Machinery and Direct Wholesale
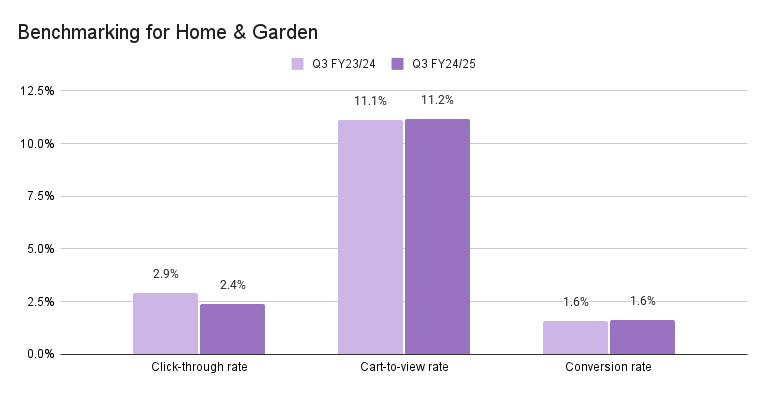
Home and Garden
The Home & Garden sector remained resilient in Q3 FY24/25, showing solid conversions and strong purchase intent. While the click-through rate dipped from 2.9% to 2.4%, those who did engage showed strong intent, with the cart-to-view rate edging up from 11.1% to 11.2%.
Even more encouraging, the conversion rate held steady at 1.6%, highlighting consistent purchase intent among engaged users. This suggests that while shoppers may be more selective at the top of the funnel, those who click through are genuinely ready to buy.
March in Australia heralds the onset of autumn, bringing with it milder temperatures, conditions that are ideal for both gardening and outdoor home improvement projects such as starting seeds, planting out seedlings, and preparing garden beds. It also means consumers are more inclined to tackle home projects. This seasonal shift likely contributed to steady engagement from high-intent shoppers in this category.
Megantic has between 20 – 30 clients in this niche, some of them include Black Mango and Outdoors Domain.
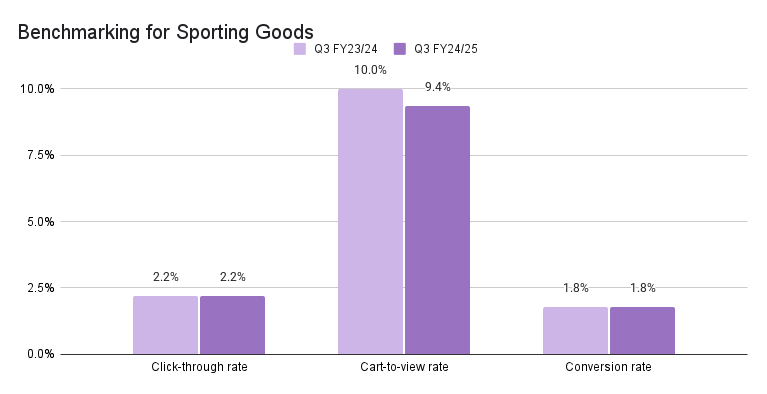
Sporting Goods
The year-on-year comparison between 2024 and 2025 for Q3 showed stable demand. The cart-to-view rate dipped slightly from 10.0% to 9.4%, and the conversion rate stayed flat at 1.8%, indicating reliable buyer intent among those who engage. For a season typically packed with outdoor activity, fitness goals, and sports programs, this consistency reflects a healthy, if cautious, consumer mindset.
We see this niche as a growing market, fuelled by increasing health awareness, evolving fitness trends, and a growing demand for social spaces within local communities. Shifting cultural attitudes have reinforced the role of sport in driving broader social outcomes, reflected in the rising popularity of social sports, fitness clubs, and wellness gyms.
Megantic has between 10 – 20 clients in this space, some of them include House of Golf and Twelve Boards Store.
Key Takeaways
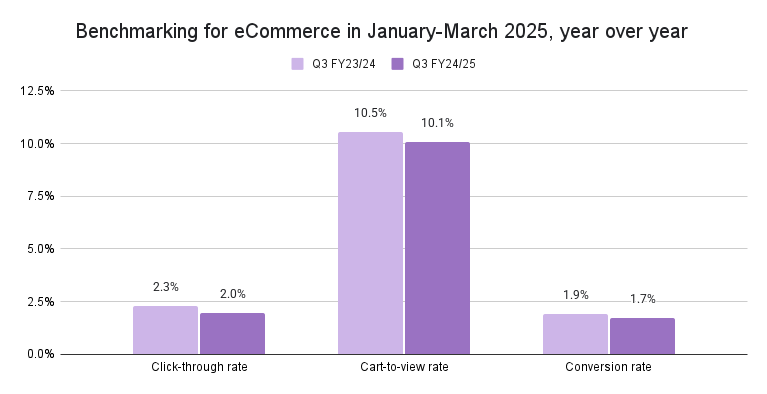
The data shows a modest decline across all key metrics: average click-through rate fell by 0.3%, cart-to-view rate dropped by 0.4%, and conversion rate dipped by 0.2%. While these changes reflect a broader shift in Australian consumer behaviour, it’s encouraging to see that most niches remain resilient.
While metrics like click-through rate CTR, CTV and CR measure bottom-of-funnel activity, we also looked at broader trends across organic search and search volume. The good news? People are still searching. In fact, organic search sessions increased between Q3 FY23/24 and Q3 FY24/25. However, despite strong top-of-funnel interest, intent to purchase appears to be softening.
We anticipate a lift in activity for retailers in Australia once election uncertainty passes and EOFY sales begin to drive urgency.
Metric-by-Metric Breakdown:
| Metric | Q3 FY23/24 | Q3 FY24/25 | Change |
|---|---|---|---|
| Click-through rate | 2.3% | 2.0% | ↓ 0.3% |
| Cart-to-view rate | 10.5% | 10.1% | ↓ 0.4% |
| Conversion rate | 1.9% | 1.7% | ↓ 0.2% |
These insights reinforce the value of ongoing benchmarking. By aligning your SEO strategy with evolving consumer behaviour and industry trends, you can make smarter, data-backed decisions that lead to stronger results.
Are you interested in learning more about Megantic’s eCommerce SEO strategy? Leave your contact info below and we’ll reach out.
![]()


")


