FY24/25 Q4 Australian eCommerce Benchmarking Data
16 July 2025 Blog Posts
How to Make the Most of Megantic’s eCommerce Benchmarking Data
Megantic’s Benchmark Report offers a closer look at which industry niches are seeing growth and what that could mean for your business. This report uses data across six key industry niches: Vehicles & Parts, Apparel & Accessories, Arts & Entertainment, Business & Industrial, Home & Garden, and Sporting Goods.
As we turn the corner into the final quarter of FY25, we assessed our pool of active clients, 100+ in APAC, to see how they were performing in comparison to last year’s fin results.
We measure these emerging retail trends using three essential metrics:
Click-Through Rate (CTR): The percentage of users who clicked on an organic Google Search result after seeing it in the search results, also known as “SERPs”.
Cart-to-View Rate (CTV): The percentage of users who added a product to their cart out of those who viewed the product page.
Conversion Rate (CR): The percentage of website visitors who completed a purchase.
So, whether you’re refining your strategy or simply curious about how others in your space are tracking, these insights can help guide more informed, realistic growth goals.
The state of eCommerce: retail shifts April – June 2025
According to the Australian Bureau of Statistics (ABS), retail turnover increased by 1.2% in June 2025, following a 0.5% rise in May after a flat April. Mid-year sales events such as EOFY helped drive discretionary spending, particularly across furniture, electronics, and apparel.
During this period, several industry developments began reshaping the eCommerce landscape. Amazon announced its withdrawal from Google Shopping Ads, while Meta introduced new indexation rules designed to expose posts and reels to wider audiences.
Another key observation emerging from this quarter is the growing impact of the Zero-Click phenomenon. As users increasingly find answers or make purchases directly within search results or platform interfaces, traditional website click-throughs have begun to decline, signalling a broader shift in how consumers engage and convert online.
Vehicles and Parts
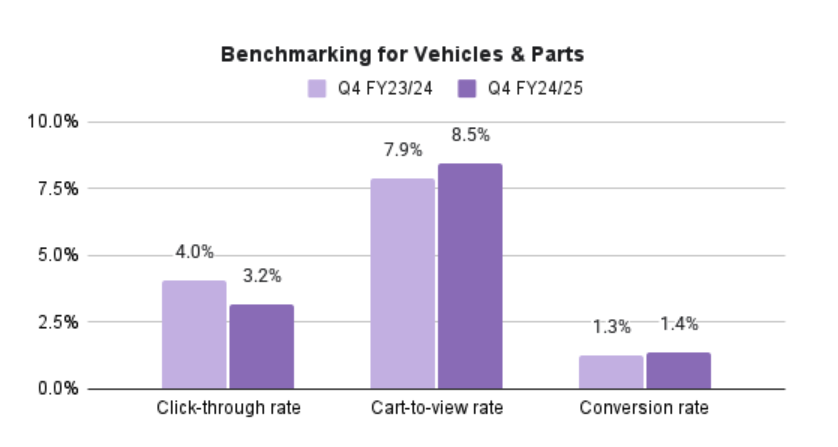
The Q4 benchmarking data for Vehicles & Parts shows mixed performance across key metrics. Click-through rate dipped from 4.0% to 3.2%, while cart-to-view rate improved from 7.9% to 8.5%. Conversion rate also saw a small uplift, rising from 1.3% to 1.4%. This suggests that while fewer shoppers are clicking through, partly influenced by the rise in zero-click searches where users find answers without leaving the search results, those who do visit are more likely to add products to their cart and complete a purchase.
With this niche, we typically find that the users searching for automotive products have a lot of knowledge about their purchasing decision, and typically are precise in their search, specifying details such as car make, model, and year to find the exact product they need. Automotive purchases, even for parts, tend to involve longer research cycles and considered decision-making.
Megantic has 20 – 30 clients within the Vehicles and Parts space, some of them include Car Builders and OCAM Industries.
Apparel and Accessories
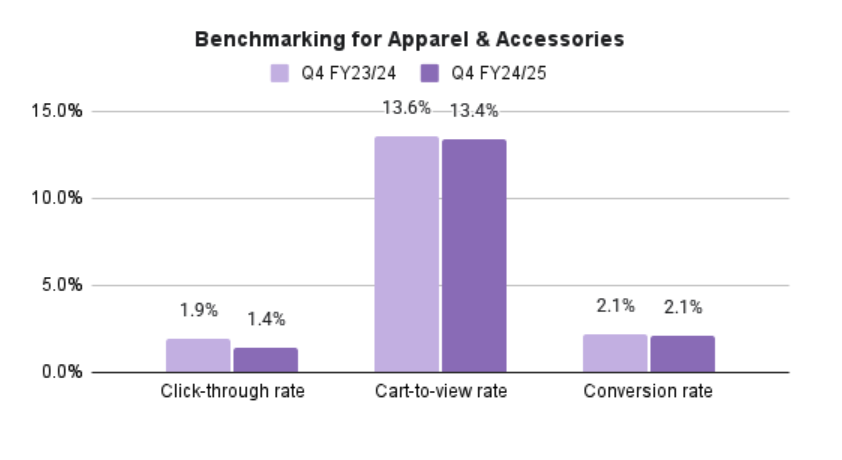
This quarter, the apparel and accessories sector experienced a mixed performance across key eCommerce metrics. Click-through rates fell from 1.9% to 1.4%, while cart-to-view rates dipped slightly from 13.6% to 13.4%. Conversion rates remained steady at 2.1%, suggesting that while fewer shoppers are clicking through, those who do are converting at the same pace as last year.
We’ve seen this category to be one of the most competitive in eCommerce, likely due to strong consumer demand, the presence of both global and local brands. It’s been a difficult year for the apparel and accessories space, with several iconic Australian brands forced to shut their doors. Notable closures for 2025 include Rivers, Millers, Noni B, Katies, Rockmans, Autograph, Crossroads, W Lane, and BeMe.
Megantic has 20 – 30 clients within this category. Some of our clients include Aquila, Ripe Maternity, and Louenhide.
Arts and Entertainment
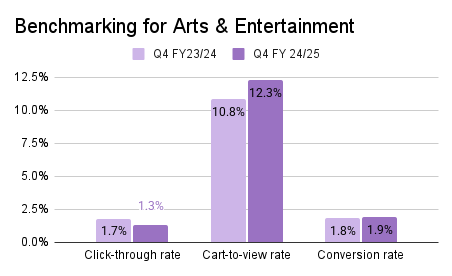
The Arts & Entertainment sector saw strong year-on-year performance. Click-through rates dipped from 1.7% to 1.3%, reflecting the rise of zero-click activity. In contrast, cart-to-view rates climbed from 10.8% to 12.3%, indicating that those who did engage were more inclined to progress toward purchase. Conversion rates held steady with a slight lift from 1.8% to 1.9%, signalling stable buyer intent despite the softer top-of-funnel activity.
The Arts & Entertainment sector appears to be feeling the pinch of cost-of-living pressures, with discretionary spending on experiences and hobbies more likely to be delayed in a climate of cautious consumer sentiment.
Megantic has between 10 – 20 clients in this space, some of them include Monte Mart, Montana Colours and Riffs and Licks.
Business and Industrial
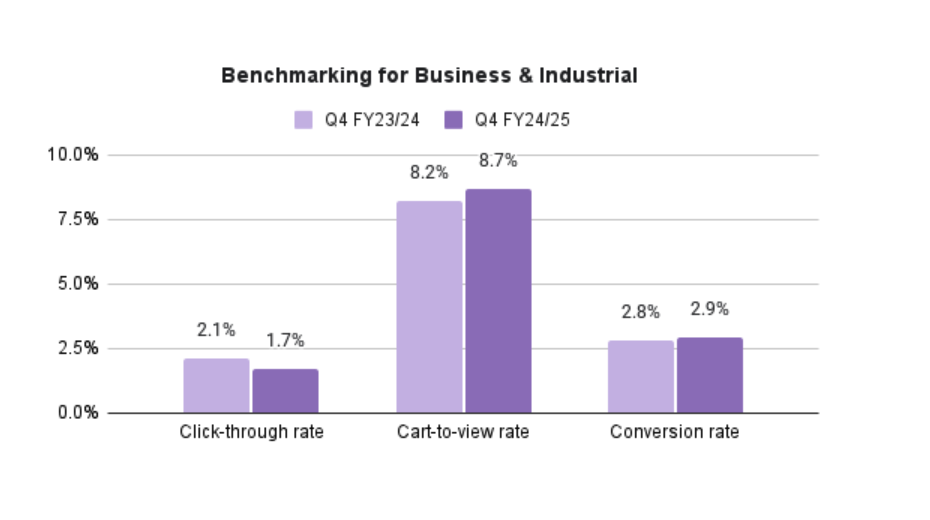
The Business and Industrial sector maintained steady purchase intent this quarter. Click-through rates eased from 2.1% to 1.7%, but cart-to-view rates rose from 8.2% to 8.7%, signalling stronger engagement once users reach product pages. Conversion rates also saw a slight lift from 2.8% to 2.9%, suggesting that those who do engage are more likely to complete their purchase. For B2B retailers, this points to the value of continuing to optimise product page experiences and sustaining momentum through to checkout.
Businesses in wholesale supply chains (especially electrical, plumbing, furniture, tools, and industrial sectors) are increasingly going digital to meet demand more efficiently. Wholesalers are embracing online channels to reach business customers more efficiently.
Megantic has between 10 – 20 clients in this space, some of our clients in this category include Asset Plant & Machinery and Direct Wholesale
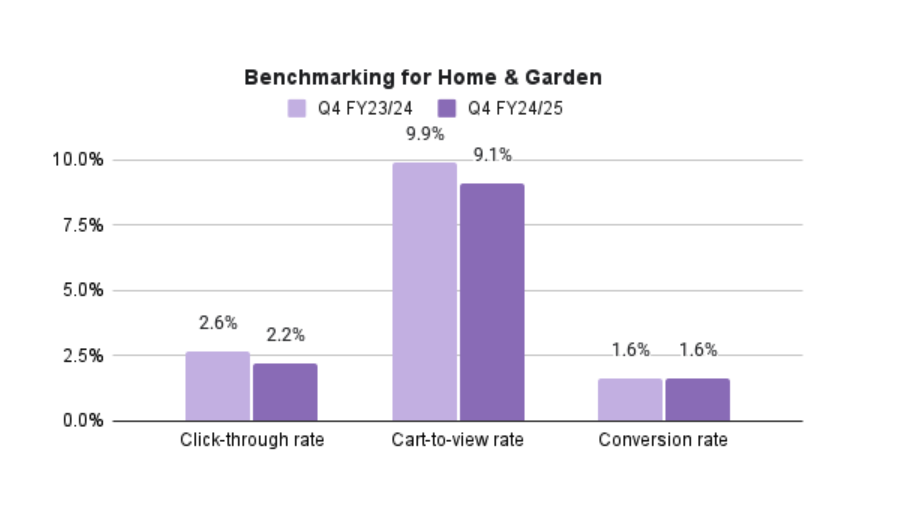
Home and Garden
The Home & Garden sector saw slight shifts in Q4 FY24/25, with the click-through rate easing from 2.6% to 2.2%. Shoppers who did engage remained interested, though the cart-to-view rate dipped from 9.9% to 9.1%. The conversion rate held steady at 1.6%, suggesting that while fewer users are entering the funnel, those who do are maintaining consistent intent to purchase. This points to a need for optimising top-of-funnel engagement while continuing to nurture high-intent visitors through to checkout.
The seasonal shift in Q4 FY24/25 could encourage more furniture purchases, especially for pieces that make homes feel more comfortable and inviting. As people spend more time indoors during autumn and early winter, they are more likely to refresh their living spaces, often pairing furniture upgrades with broader home improvement projects. While outdoor furniture can still see interest, the main lift usually comes from items suited to indoor living.
Megantic has between 20 – 30 clients in this niche, some of them include Black Mango and Outdoors Domain.
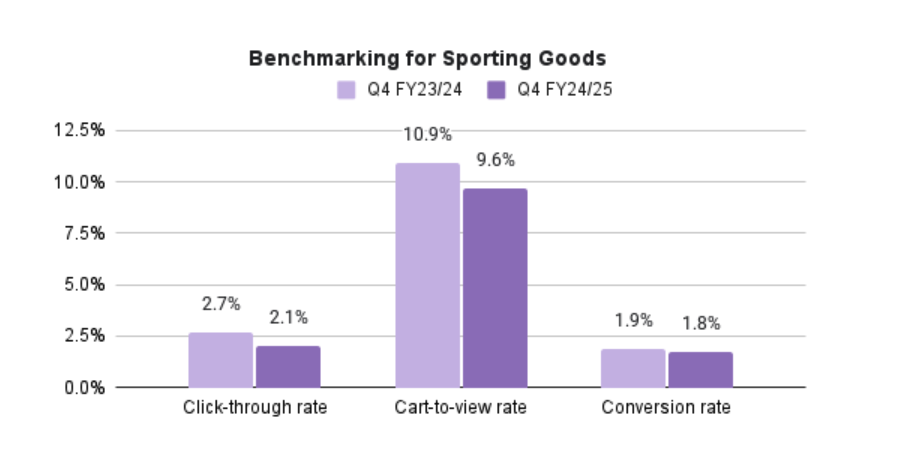
Sporting Goods
The year-on-year comparison for Q4 shows a softer performance in the Sporting Goods sector. The click-through rate eased from 2.7% to 2.1%, while the cart-to-view rate fell from 10.9% to 9.6%. Conversion rates remained steady at 1.8%, signalling that those who do engage maintain consistent purchase intent. For a period often tied to summer sports, holiday gift buying, and fitness resolutions, this steadiness at the final purchase stage suggests committed buyers, even as overall engagement levels dip.
We see this niche as a growing market, driven by increasing health awareness, evolving fitness trends and a rising demand for social spaces within local communities. Changing cultural attitudes have strengthened the role of sport in supporting broader social outcomes, reflected in the growing popularity of social sports, fitness clubs and wellness-focused gyms.
Megantic has between 10 – 20 clients in this space, some of them include House of Golf and Twelve Boards Store.
Key Takeaways
The data indicates a slight downturn across key metrics: average click-through rate decreased by 0.3%, cart-to-view rate by 0.4%, and conversion rate by 0.2%.
This aligns with the growing impact of zero-click experiences, where users increasingly find what they need within AI overviews or platform interfaces instead of visiting individual eCommerce sites. However, conversion rates have remained steady, closely matching last financial year’s performance.
These insights reinforce the value of ongoing benchmarking. By aligning your SEO strategy with evolving consumer behaviour and industry trends, you can make smarter, data-backed decisions that lead to stronger results.
Are you interested in learning more about Megantic’s eCommerce SEO strategy? Leave your contact info below and we’ll reach out.
![]()


")


