FY26 Q3 Australian eCommerce Benchmarking Data
16 April 2026 Blog Posts
The state of eCommerce: retail shifts January to March 2026
The Australian eComm market continues to grow, 2025 showed increases of 14% and reached a record $82.6 billion spend (Australia Post eCommerce Report, 2026).
“Across the generations, the numbers reveal a consistent desire for more: more value, convenience, speed and choice – spanning the entire shopping journey from discovery through to delivery. ” – Paul Graham, Group Chief Executive Officer & Managing Director, Australia Post
While these figures signal renewed momentum, the broader eCommerce landscape remains mixed. The January to March quarter was defined by rapid change across AI, Google Core updates and evolving geopolitical influences.
The current financial year is proving to be a highly significant period for eCommerce. As buyer shopping trends evolve, so too must the discovery strategy that serves them. Across the board, marketing leaders are encouraging brands to prepare themselves for an agentic future.
AI is reshaping commerce, with AI-orchestrated revenue set to reach 30%, and we’re already seeing more and more businesses embedding agentic AI into their marketing, sales and customer support departments. A trend we will likely see more of in 2026 is the Zero-Click phenomenon, which poses a fundamental shift in how Australians search, discover, and interact with brands online. New research suggests AI Overviews are reducing click-through rates by 35%, indicating that web users are clicking less and impressions are starting to matter more.
A useful way to think about the retail market right now is in terms of two-speed, while many households are disciplined on everyday spending and sensitive to interest rate hikes, they remain willing to purchase products they believe to be high-value. In fact, the Australian Post found that 81% of Australian shoppers seek the best deals, with a clear value and social proof driving conversion.
There are a lot of things affecting Australia’s retail market right now, and Q3 could be defined by ongoing geopolitical tensions, changing US tariff protocol, which fuels uncertainty and inflation, prompting the Reserve Bank of Australia (RBA) to lift interest rates for the second consecutive month to 4.1%.
The outbreak of the Middle East conflict has further disrupted oil markets, driving sharp increases in fuel prices across Australia and adding further strain on retailers and e-shopping distributors alike. Many Australians remain cautious with their spending, focusing on essentials and looking for genuine value rather than making spontaneous purchases.
Megantic’s Benchmarking Report provides in-depth data about how different industry niches are experiencing these shifts and what it means for your eCommerce store.
The FY26Q3 Australian eCommerce Benchmarking Report and what it means for you
This benchmarking edition focuses on six core sectors, Apparel & Accessories, Vehicles & Parts, Arts & Entertainment, Business & Industrial, Home & Garden, and Sporting Goods and shines a light on the patterns, trends and stats we can share back to retailers looking to stay competitive.
We are now at a point where we can draw on three years of ongoing analysis to reveal the key trends shaping Australia’s eComm landscape and offer valuable insights at an industry level. To provide a clear benchmark for performance, we analysed data from over 100 Megantic clients. This report compares current results with those from the same quarter over the past two financial years.
While the benchmarking data shows significant recovery stats, the market’s overall performance has not fully recovered to historical levels in 23/24 data. A clear opportunity lies within a higher cart-to-view rate when coupled with the strong conversion rate, which indicates improved bottom-funnel efficiency and stronger purchase completion.
We use three essential metrics to measure these emerging retail trends. These metrics offer immense value and insights, and we believe that these metrics could very well soon expand and change as the AI revolution continues.
Benchmarking Metrics:
Click-Through Rate: The percentage of searchers who click your link on the search engine results page.
Cart-to-View Rate: The percentage of users who added a product to their cart out of those who viewed the product page.
Conversion Rate: The percentage of website visitors who completed a purchase.
Apparel and Accessories
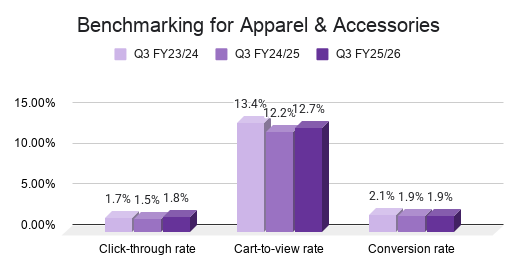
The Apparel & Accessories sector showed encouraging signs for FY26Q3, particularly with on-site engagement. Click-through rates have improved greatly from 1.5% in FY24/25 to 1.8% in FY25/26, indicating renewed top-of-funnel engagement. Cart-to-view rate rebounded from 12.2% in FY24/25 to 12.7% in FY25/26, recovering from last year’s dip and signalling stronger product interest and intent once users land on-site. While conversion rates softened slightly over time, declining from 2.1% in FY23/24 to 1.9% in FY24/25 and holding flat at 1.9% into FY25/26.
Following the high-volume sales of BFCM and Christmas, retailers in this time period must navigate a landscape defined by more deliberate shopper behaviour and intense market competition. Particularly from pure-play online marketplaces such as Amazon and Temu, which cater to the consumer demand for one-stop shopping convenience.
Megantic has emerged as a leader within the fashion and accessory space, with 30 – 40 apparel and accessory brands joining the Megantic family, including Showpo, Calibre, Oxford, Peppermayo, Zamels, All Things Golden, Aquila, Louenhide and Metro Workwear.
Vehicles and Parts
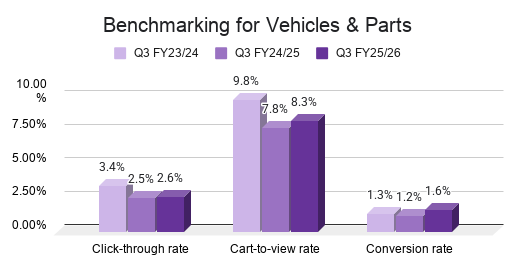
The Vehicles & Parts sector shows mixed performance across the last three financial years. Notably, conversion rates having improved overall, rising from 1.3% to 1.6% in FY25/26, indicating stronger performance at the final stage of the purchase journey. While the click-through rates declined from 3.4% in FY23/24 to 2.5% in FY24/25, with a slight recovery to 2.6% in FY25/26. Cart-to-view rates mirrored this fluctuation, falling from 9.8% to 7.8% in the period FY23/24 to FY24/25 before recovering to 8.3%.
The decline in clicks can also be viewed in the context of the Zero-Click phenomenon, where users are increasingly finding answers directly within search results or AI-driven interfaces without needing to visit a website. The automotive category remains highly intent-driven, with users searching by precise specifications such as make, model, and year. This reinforces the importance of structured data, accurate fitment information, and strong product taxonomy.
The earlier decline across metrics likely reflects broader market pressure, including rising costs and delayed purchasing behaviour, while the rebound in FY25/26 signals renewed confidence and more targeted purchasing. Overall, the trend reflects a more selective and research-driven automotive audience. When users find the exact product match, they are increasingly confident to complete the purchase.
Megantic has 20 – 30 clients within the Vehicles and Parts space, some of them include TRAPO, Car Builders, OCAM Industries and Everything Caravans.
Arts and Entertainment
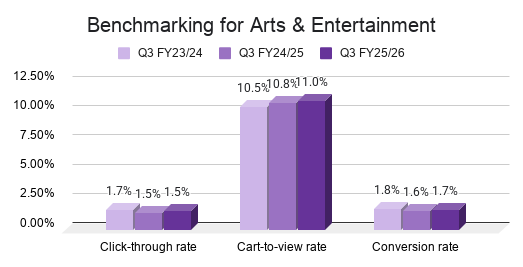
The Arts & Entertainment sector showed continued strength in cart-to-view rates, having steadily increased from 10.5% in FY23/24 to 10.8% in FY24/25 and then up again to 11.0% in FY25/26. This could be a sign of stronger product interaction and purchase intent from users who reach client sites.
Overall, the sector rebound suggests the Arts & Entertainment Sector continues to feel the effects of tighter household budgets, as consumers take a more cautious approach to discretionary spending, often postponing purchases tied to experiences and hobbies. This trend is a clear indicator of the ongoing pressure on non-essential spending.
Despite this, there are signs of recovery in conversion rates, which saw a marginal increase from 1.6% in FY23/24 to 1.7% in FY24/25, suggesting a slight improvement in the rate of purchase completion. Conversely, click-through rates have softened, declining from 1.7% to 1.5% and then remaining steady.
Megantic partners with 10 – 20 clients in this category, including Mont Marte, Montana Colours, and Riffs & Licks.
Business and Industrial
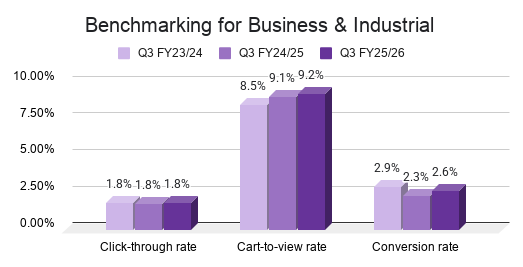
The Business & Industrial sector delivered a mixed performance across the past three financial years. The sector’s cart-to-view rates have steadily improved from 8.5% to 9.1% and up again to 9.2%, signalling stronger on-site engagement and growing purchase intent once users land on product pages.
This upward trajectory indicates that while click-through volume may have decreased, the remaining users are more qualified and inclined to proceed to the next step. This is further evidenced by a recovering conversion rate, which has risen from 2.3% in FY24/25 to 2.6% in FY25/26, although it has not yet reached its previous peak. Click-through rates dipped in FY24/25, dropping from 1.7% to 1.5% and holding flat.
Megantic has between 10 – 20 clients in this space; some of our clients in this category include Asset Plant & Machinery and Direct Wholesale.
Home and Garden
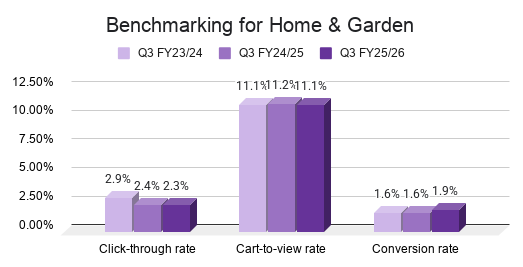
The Home & Garden sector shows a clear shift in performance across FY24 to FY26. Click-through rates declined from 2.9% in FY23/24 to 2.4% in FY24/25 and softened further to 2.3% in FY25/26, signalling continued pressure at the top of the funnel and increased competition for attention.
In contrast, cart-to-view rates remained remarkably stable (11.1% → 11.2% → 11.1%), indicating consistent on-site engagement and steady product interest once users land. Conversion rates saw the biggest metric improvement, jumping from 1.6% to 1.9%, suggesting stronger bottom-funnel performance and more decisive purchasing behaviour. The uplift in conversion alongside flat engagement suggests improved alignment between product offering, pricing, and user expectations.
Seasonal weather and environmental factors remain highly influential in this sector. The January to March period categorised with warmer temperatures and the potential for catastrophic weather events over the January to March period across Australian states, directly impacting gardening products and furniture demand.
Megantic has between 20 and 30 clients in this niche, including Kitchen Warehouse, Pony Rider and Matchbox.
Sporting Goods
Megantic’s data reveals a category that is winning attention but losing conviction at the point of purchase. Click-through rates held steady at 2.2% across FY23/24 and FY24/25 before ticking up to 2.4% in FY25/26; a positive signal of improving visibility and upper-funnel engagement, likely driven by sustained consumer interest in health and fitness.
However, this uplift is offset by a steady decline in cart-to-view rate, dropping from 10.0% to 9.4% and then to 8.9%, suggesting that while more users are clicking through, fewer are progressing deeper into the purchase journey.
Conversion rates follow a similar softening trend, holding at 1.8% before declining to 1.6% in FY25/26. This points to growing friction or hesitation at the final stages of purchase, potentially driven by rising costs of living for Australian consumers.
Interest in sporting goods remains resilient, likely fuelled by ongoing health and fitness trends, but brands are facing increased competition and more selective consumers. Overall, the category reflects stronger growth on the discovery side. The opportunity lies in improving on-site experience, reinforcing value, and reducing purchase friction to better capture this sustained demand.
Megantic has between 10 – 20 clients in this space, some of them include House of Golf, Whack Sports and Wahu.

Key Takeaways
This benchmarking data information aims to help Aussie retailers better understand the forces transforming the ways of shopping and search behaviour, so as to prepare for the next wave of growth. And we’ll monitor the final quarter of the financial year and beyond as we enter a high-pressure EOFY period.
If you’re refining your online search strategy or simply curious about how others in your space are tracking, these insights can help guide more informed, realistic growth goals.
Metrics Breakdown
|
Metric |
Q3 FY23/24 |
Q3 FY24/25 |
Q3 FY25/26 |
Change FY24 → FY26 |
|
Click-through rate |
2.3% |
2.0% |
2.1% |
+0.1 |
|
Cart-to-view rate |
10.5% |
10.1% |
10.2% |
+0.1 |
|
Conversion rate |
1.9% |
1.7% |
1.9% |
+0.2 |
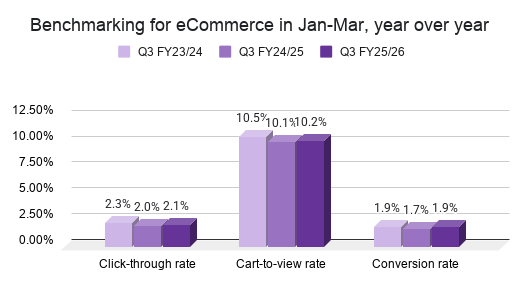
Across the six key industry sectors analysed, performance improved from FY24/25 to FY25/26, with gains driven by stronger bottom funnel efficiency. Conversion rate increased from 1.7% to 1.9% (+0.2), returning to FY23/24 levels, while cart-to-view rate remained stable at 10.2% (+0.1). Click-through rate saw a modest recovery from 2.0% to 2.1% (+0.1), but still sits below FY23/24 levels (2.3%), highlighting ongoing changes at the top of the funnel.
The Advent of AI
Our best recommendation to all retailers in the market is to strongly align your SEO and AEO strategy with evolving consumer behaviour and industry trends, so that you can make smarter, data-backed decisions that lead to stronger results.
In fact, we were recently recognised for our commitment to innovation at the Global Agency Awards 2026, where we won Best eCommerce Agency of the Year for a third year. The AI visibility tools and frameworks our team has been developing are specifically for eCommerce brands. The Megantic AI Toolkit™ turns complex search and AI signals into clear, scalable content actions. So you can better understand how your brand is seen online, revealing how visible your website is across major AI platforms, compared to competitors.
To celebrate our award win and the launch of our AI capabilities, we’re offering $1M+ figure brands, a 1-month trial of our Megantic AI Toolkit™, which includes thorough AI Visibility Audits & readiness plans. To find out where you stand in the new era of Answer Engine Optimisation (AEO), enter ‘FREE TRIAL’ in the Message box below, and we’ll be in touch with your personalised AI Visibility Report and deep analysis if you qualify.
![]()


")


