FY26 Q1 Australian eCommerce Benchmarking Data
5 October 2025 Blog Posts
How to Make the Most of Megantic’s eCommerce Benchmarking Data
Megantic’s Benchmark Report provides an in-depth view of how different industry niches are performing and what these shifts mean for your business. Drawing on three years of ongoing data and analysis, it reveals key trends shaping Australia’s eCommerce landscape and offers valuable insights for retailers looking to stay competitive. This edition focuses on six core sectors: Vehicles & Parts, Apparel & Accessories, Arts & Entertainment, Business & Industrial, Home & Garden, and Sporting Goods.
In this Q1 edition, we compared results from the same quarter over the past two financial years, analysing data from more than 100 Megantic clients to see how they’re performing this time around.
We measure these emerging retail trends using three essential metrics:
Click-Through Rate (CTR): The percentage of users who clicked on an organic Google Search result after seeing it in the search results, also known as “SERPs”.
Cart-to-View Rate (CTV): The percentage of users who added a product to their cart out of those who viewed the product page.
Conversion Rate (CR): The percentage of website visitors who completed a purchase.
So, whether you’re refining your strategy or simply curious about how others in your space are tracking, these insights can help guide more informed, realistic growth goals.
The state of eCommerce: retail shifts July-September 2025
Australians spent a record $20.7 billion online in Q1 FY26, up 15% year-on-year and 6.2% quarter-on-quarter, confirming the strong momentum of digital shopping nationwide (Power Retail, October 2025). In response, Australia Post has expanded its operations ahead of the peak shopping season, bringing on additional team members, enhancing its delivery network, and rolling out a new fleet of electric vehicles to keep up with rising online demand.
“We’re preparing for what’s shaping up to be our biggest peak delivery season on record” – AusPost GM Enterprise and Government, Chelsea O’Reilly.
While these figures signal renewed momentum, the broader eCommerce landscape remains mixed. The July to September quarter was defined by rapid change across technology, digital marketing and retail, from major SEO algorithm updates to evolving social media strategies, retail innovation and a wave of store closures. At the same time, competition from global marketplaces like Temu continues to intensify, reshaping consumer expectations and pricing dynamics. On the regulatory front, the Buy Now, Pay Later sector faced new compliance rules, bringing it under the same framework as traditional credit products, a significant step aimed at curbing rising debt levels among Gen Z shoppers.
Another key observation this quarter is that click-through rates fell from 2.6% to 1.95%, the lowest level recorded over the past two financial years. This comes as a surprise, given the continued growth of the eCommerce industry. According to Australia Post’s 2025 eCommerce Customer Spending Report, online retail spend rose by 12% year-on-year in 2024, signalling renewed consumer confidence and stronger digital performance across the board. However, this disconnect between rising spend and declining CTR points to the growing impact of the Zero-Click phenomenon, where users increasingly find the answers or insights they need directly within search results. It highlights a fundamental shift in how Australians search, discover and interact with brands online, with visibility now extending far beyond the traditional click.
According to the latest Roy Morgan Consumer Confidence Report, national confidence fell by 2.1 points to 83.0, marking its second consecutive week of decline after the Reserve Bank decided to keep interest rates steady at 3.6% (October,2025). In the last six months, the Reserve Bank of Australia (RBA) cut its cash rate three times and while much of 2025 has been shaped by optimism around potential rate cuts, the lasting effects of earlier hikes and ongoing inflation are still being felt. Many Australians remain cautious with their spending, focusing on essentials and looking for genuine value rather than making spontaneous purchases.
This shift in sentiment is clearly visible in eCommerce behaviour. The Apparel and Accessories sector recorded the lowest click-through, cart-to-view and conversion rates in Q1 FY25/26 compared to the previous three years, reflecting the impact of tighter discretionary budgets and emphasis on essential items. Still, there’s reason for optimism as we move into Q2. Consumer confidence is beginning to rebuild, and analysts expect a strong uplift in online activity driven by what’s forecast to be one of the biggest Black Friday and Cyber Monday shopping periods to date.
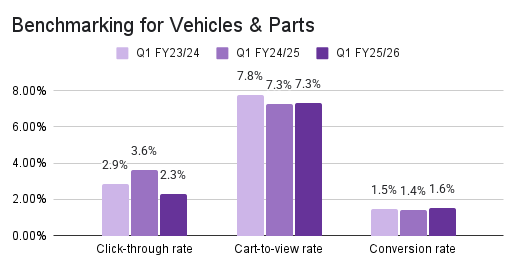
Vehicles and Parts
The Q1 benchmarking data for the Vehicles & Parts sector shows mixed performance across the last three financial years. Click-through rate fell sharply from 3.6% in FY24/25 to 2.3% in FY25/26, after previously climbing from 2.9% in FY23/24, suggesting softer engagement at the top of the funnel. Cart-to-view rates eased slightly from 7.8% in FY23/24 to 7.3% in both FY24/25 and FY25/26, indicating steady intent among users once on-site. Meanwhile, conversion rates remained relatively stable, improving marginally from 1.4% to 1.6% this year.
While the drop in click-through rate suggests a cooling of initial interest, the ‘Zero-Click’ phenomenon could also be influencing results, where users find what they need directly in search without visiting the merchant’s site. The automotive audience remains highly deliberate and detail-driven, often searching by exact make, model, or year. This reinforces the need for strong product taxonomy, detailed metadata, and accurate fitment data to support the long research and decision-making cycles that define this category. The increasing conversion rate (1.6%) reflects this precision-based behaviour, showing that once shoppers find the right product in this sector, they tend to complete the purchase.
Megantic has 20 – 30 clients within the Vehicles and Parts space, some of them include Car Builders and OCAM Industries.
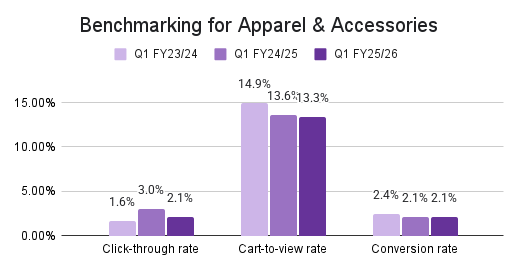
Apparel and Accessories
This quarter, the Apparel & Accessories category saw a mild decline across key performance indicators, suggesting that shoppers remain cautious despite consistent interest in browsing. Click-through rate dropped from 3.0% in Q1 FY24/25 to 2.1% in Q1 FY25/26, reflecting lower engagement from search and ad impressions. Similarly, the cart-to-view rate slipped from 13.6% to 13.3%, and the conversion rate softened from 2.1% to 2.1%, maintaining stability but down from the FY23/24 peak.
It’s been a difficult year for the apparel and accessories space, with several iconic Australian brands forced to shut their doors. Notable closures for 2025 include Rivers, Millers, Noni B, Katies, Rockmans, Autograph, Crossroads, W Lane, BeMe and very recently, Famous Footwear (officially closing their doors in December 2025).
Megantic has 20 – 30 clients within this category. Some of our clients include Aquila, Ripe Maternity, and Louenhide.
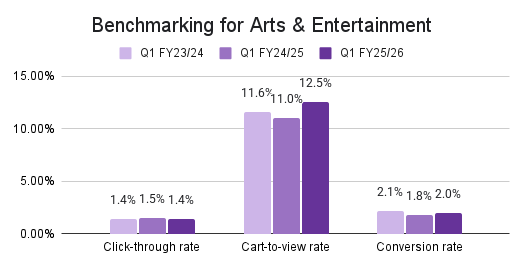
Arts and Entertainment
The Arts & Entertainment sector showed steady engagement this quarter with slight improvement across most eCommerce metrics. Click-through rates held flat at 1.4%, indicating consistent visibility and interest from audiences. The standout performer was cart-to-view rate, which lifted from 11.0% to 12.5%, suggesting stronger purchase intent and better on-site product engagement. Conversion rates also showed a mild recovery, rising from 1.8% to 2.0%, reflecting a modest improvement in purchase completion.
This rebound suggests the Arts & Entertainment Sector continues to feel the effects of tighter household budgets, as consumers take a more cautious approach to discretionary spending, often postponing purchases tied to experiences and hobbies.
Megantic partners with 10 – 20 clients in this category, including Mont Marte, Montana Colours, and Riffs & Licks.
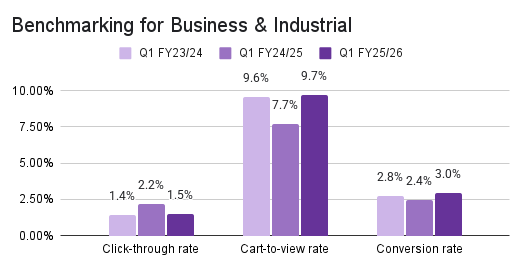
Business and Industrial
The Business & Industrial sector delivered a mixed performance across the past three financial years. Click-through rates rose sharply from 1.4% in FY23/24 to 2.2% in FY24/25, before easing to 1.5% in FY25/26, suggesting the zero-click phenomenon at play. In contrast, cart-to-view rates rebounded strongly this year, climbing from 7.7% to 9.7%, the highest level in three years, indicating stronger on-site engagement and higher buyer intent once users land on product pages. Meanwhile, conversion rates continued their upward trend, improving from 2.4% to 3.0%, a sign that checkout optimisation and clearer value propositions are paying off.
Despite a softer start in click engagement, the sector’s bottom-funnel metrics reflect solid user intent and effective conversion pathways.
Megantic has between 10 – 20 clients in this space. Some of our clients in this category include Machines4U, Asset Plant & Machinery and Direct Wholesale.
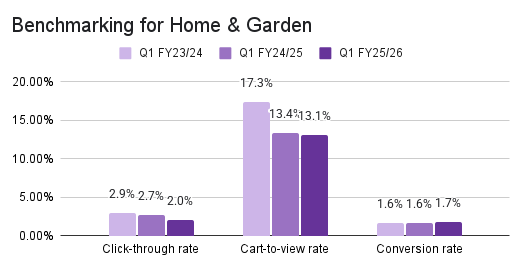
Home and Garden
The Home & Garden sector showed mixed results across FY24 to FY26. Click-through rates steadily declined from 2.9% in FY23/24 to 2.7% in FY24/25 and down again to 2.0% in FY25/26, suggesting softer engagement at the top of the funnel. However, shoppers who did reach product pages demonstrated stable purchase intent, with cart-to-view rates holding relatively strong (17.3% → 13.4% → 13.1%) and conversion rates slightly improving from 1.6% to 1.7%.
This performance points to a more discerning audience that’s engaging less often but converting at similar or better rates, likely reflecting a focus on value and quality over impulse buys. Seasonal trends also play a role, as Q1 aligns with winter in Australia, when consumers shift from outdoor projects toward indoor renovations and home improvement planning, sustaining steady demand despite cooler engagement metrics.
Megantic has between 20 – 30 clients in this niche, some of them include Black Mango and Kitchen Warehouse.
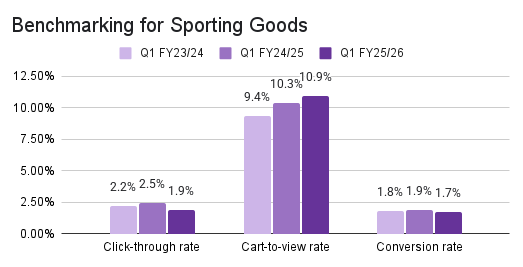
Sporting Goods
The Sporting Goods sector saw a mixed performance across Q1 FY23/24 to FY25/26. Click-through rates peaked in FY24/25 at 2.5% before easing to 1.9% in FY25/26, suggesting that while interest in sporting goods remains high, competition for attention has intensified. In contrast, the cart-to-view rate rose steadily from 9.4% to 10.9%, signalling that shoppers who do click through are showing stronger engagement and product intent once on-site. However, conversion rates softened slightly from 1.9% to 1.7%, implying friction near checkout or cautious final-stage decision-making.
This category continues to reflect seasonal and cultural trends tied to fitness resolutions, outdoor recreation, and community sports programs. As Australians embrace wellness-driven lifestyles and invest in both home and team-based sporting activities, we expect ongoing demand, though with growing price sensitivity and a need for brands to differentiate through value, experience, and trust.
Megantic has between 10 – 20 clients in this space, some of them include House of Golf, Whack Sports and Altra Running Australia.
Key Takeaways
Across the last three years, the data indicates a steady softening in performance across all key eCommerce metrics. The click-through rate (CTR) declined marginally each year, suggesting users are becoming more selective in what they engage with and also the growing impacts of the Zero-Click phenomenon, which has been shaped by LLMs like ChatGPT and Gemini and the way they display AI-generated answers. Our AI Division continues to track the latest search trends and the ways large language models interpret and summarise web content. Having a holistic SEO agency during a time of rapid change is crucial to ensure your site remains structured, relevant and authoritative enough to be referenced in AI-generated overviews, particularly with the rise of the Zero-Click phenomenon. As eCommerce SEO specialists, we take a holistic, data-driven approach tailored to our clients’ business goals, helping brands stay visible and competitive. We also explore the ways traditional search is changing and what this means for your business strategy.
This gradual decline reflects broader consumer trends across Australia, characterised by cautious spending amid persistent cost-of-living pressures and shifting household budgets. Despite these small declines, the overall consistency across three years points to resilience within eCommerce, where shoppers remain active but increasingly sensitive to economic changes.
As confidence returns post-election and BFCM promotions ramp up, we anticipate stronger buyer intent and conversion recovery in the second quarter of FY26. These insights reinforce the value of ongoing benchmarking. By aligning your SEO strategy with evolving consumer behaviour and industry trends, you can make smarter, data-backed decisions that lead to stronger results.
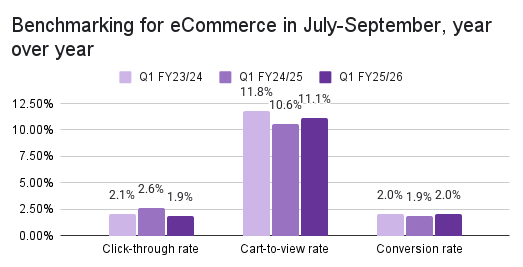
Metrics Breakdown
|
Metric |
Q1 FY23/24 |
Q1 FY24/25 |
Q1 FY25/26 |
Change FY24 → FY26 |
|
Click-through rate |
2.1% |
2.6% |
1.9% |
-0.7% |
|
Cart-to-view rate |
11.8% |
10.6% |
11.1% |
+0.5% |
|
Conversion rate |
2.0% |
1.9% |
2.0% |
+0.1% |
We’ll monitor the next quarter and beyond as we enter what many marketing teams are already calling potentially the biggest BFCM ever.
Are you interested in learning more about Megantic’s eCommerce SEO strategy? Leave your contact info below and we’ll reach out.
![]()


")


